
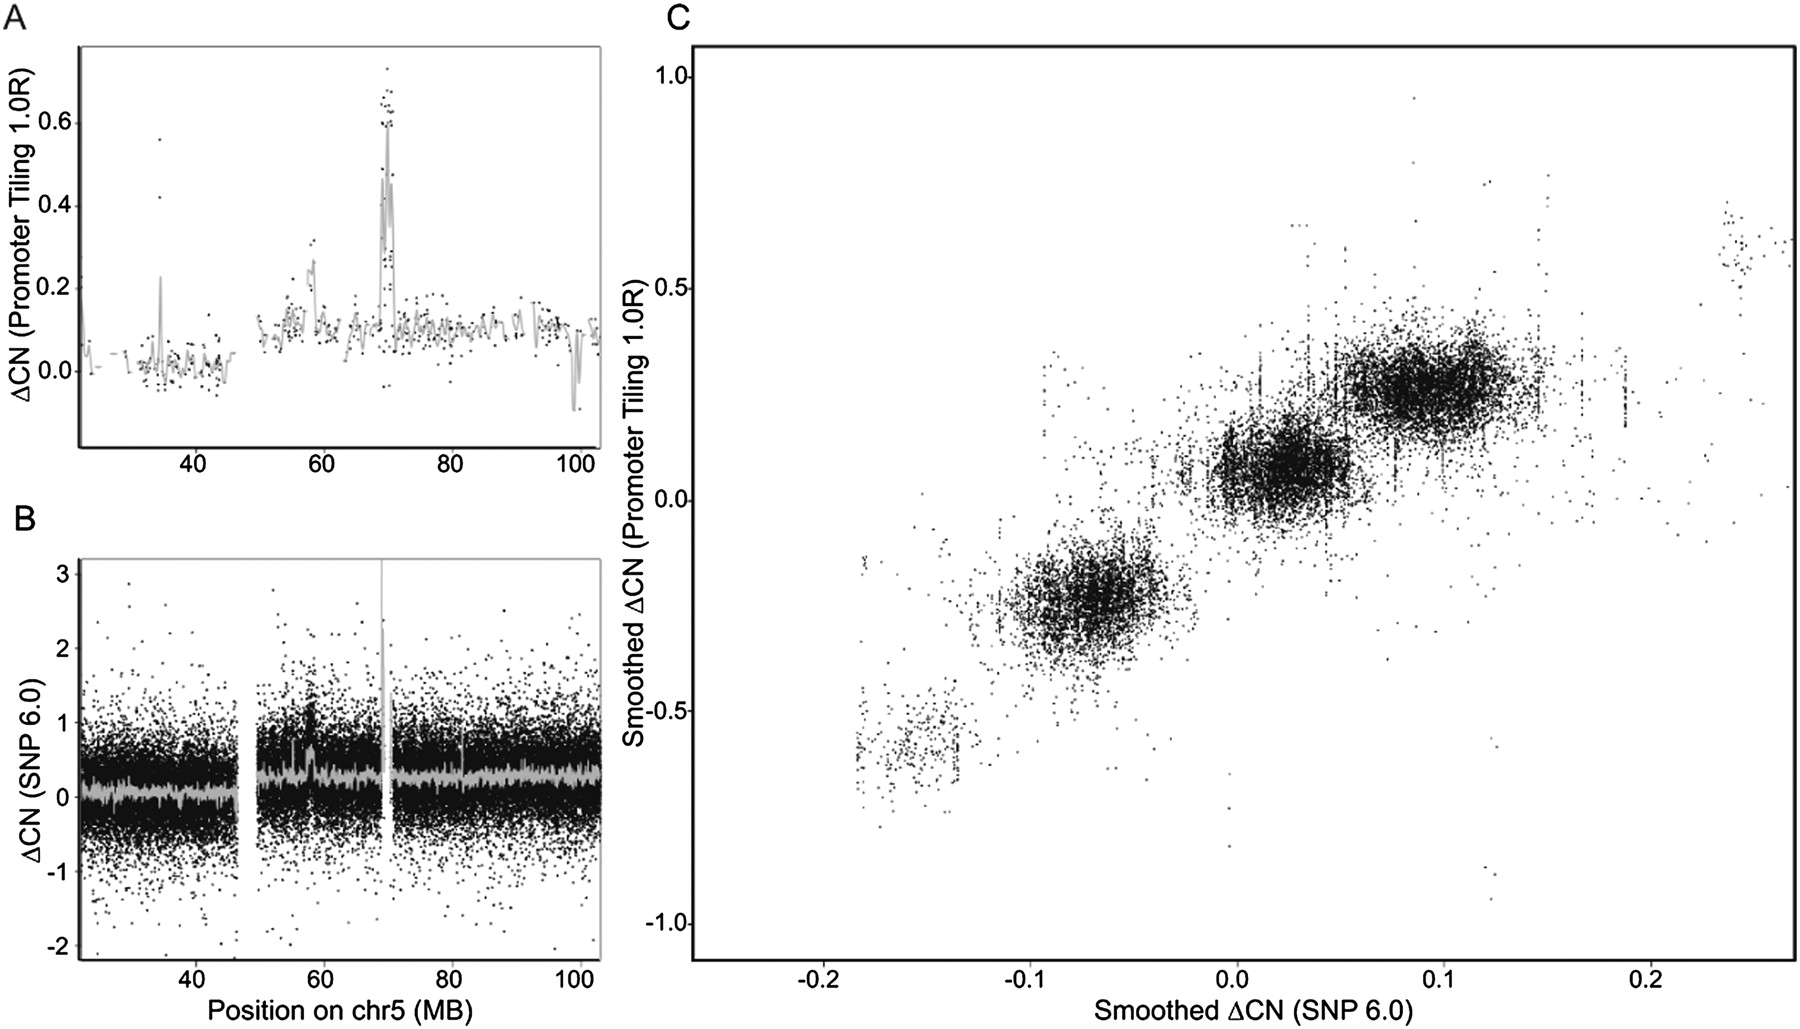
Using promoter tiling arrays to estimate changes in copy number. (A) Y-axis is the difference in copy number between the prostate cancer and normal epithelial cell line using the Affymetrix Promoter 1.0R array along human chromosome 5. The gray line represents kernel-smoothed differences over 200 kb. (B) Y-axis shows the difference in copy number using the Affymetrix SNP 6.0 array along the same region of chromosome 5. The gray line represents kernel-smoothed differences over 50 kb. (C) X-axis and y-axis represent the smoothed copy number changes between the prostate cancer and epithelial cell lines for the Promoter 1.0R and SNP 6.0 arrays, respectively, genome-wide over a common set of loci.


