
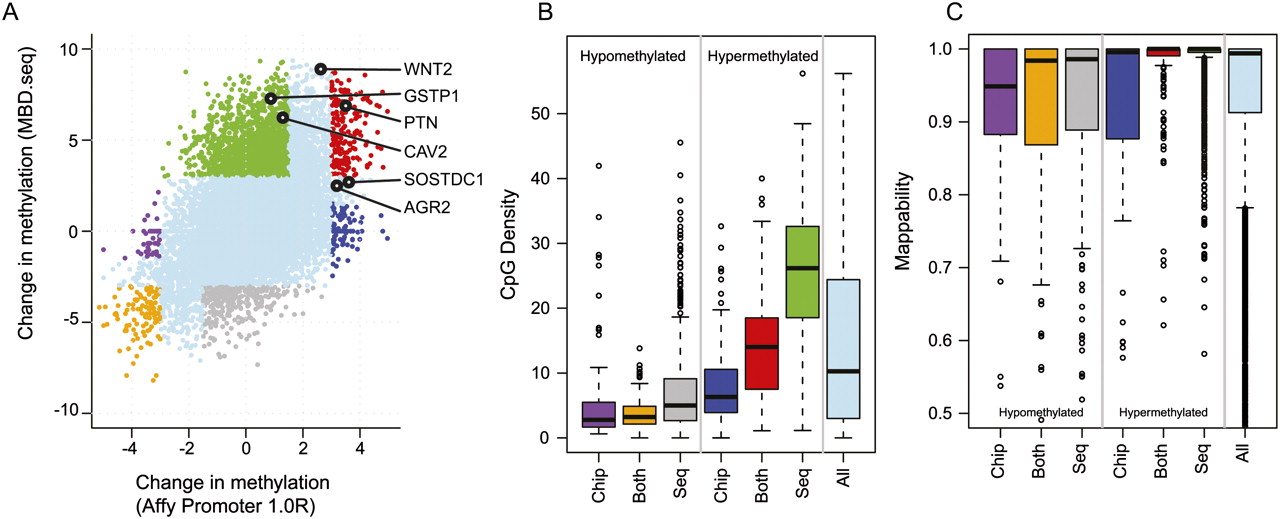
Comparison of MBD-SF tiling array and sequencing data. (A) Differential methylation Z-scores between LNCaP and PrEC cells using MBD-SF-seq (y-axis) and MBD-SF-chip (x-axis). The six validated genes that are shown in Supplemental Figures 3A and 4 are indicated with black dots. The remaining dot colors are chosen according to the differential methylation concordance between MBD-SF-seq and MBD-SF-chip Z-score as depicted in B. Note that some truly differentially methylated promoters, such as WNT2, are deemed “Indeterminate” by this concordance classification. (B) Box-and-whisker plots of CpG density for concordant and discordant differentially methylated promoters, with colors corresponding to the cutoffs shown in A. (C) Box-and-whisker plots of sequencing mapability of the concordant and discordant differentially methylated promoters, using the colors from A.


