
Figure 4.
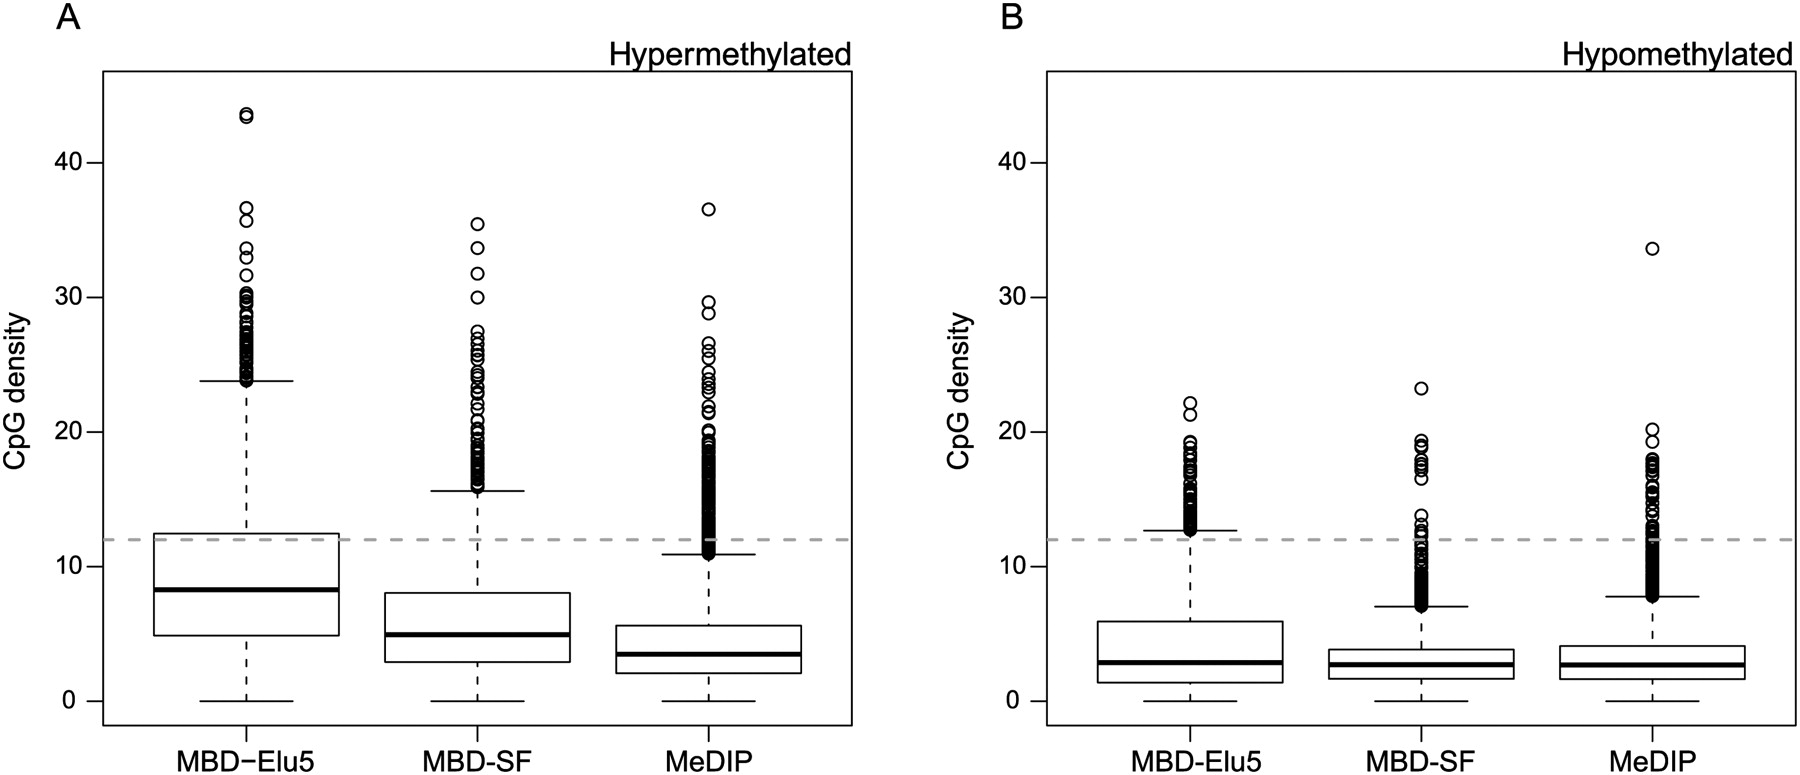
Box-and-whisker plots of CpG density for putative DMRs (at estimated false discovery rate of 5%) between LNCaP and PrEC cells. Shown are hypermethylated (A) and hypomethylated (B) regions.
(Downloading may take up to 30 seconds. If the slide opens in your browser, select File -> Save As to save it.)
Click on image to view larger version.
Box-and-whisker plots of CpG density for putative DMRs (at estimated false discovery rate of 5%) between LNCaP and PrEC cells. Shown are hypermethylated (A) and hypomethylated (B) regions.
 CiteULike
 Delicious
 Digg
Digg Facebook
 Google+
 Reddit
 Twitter
