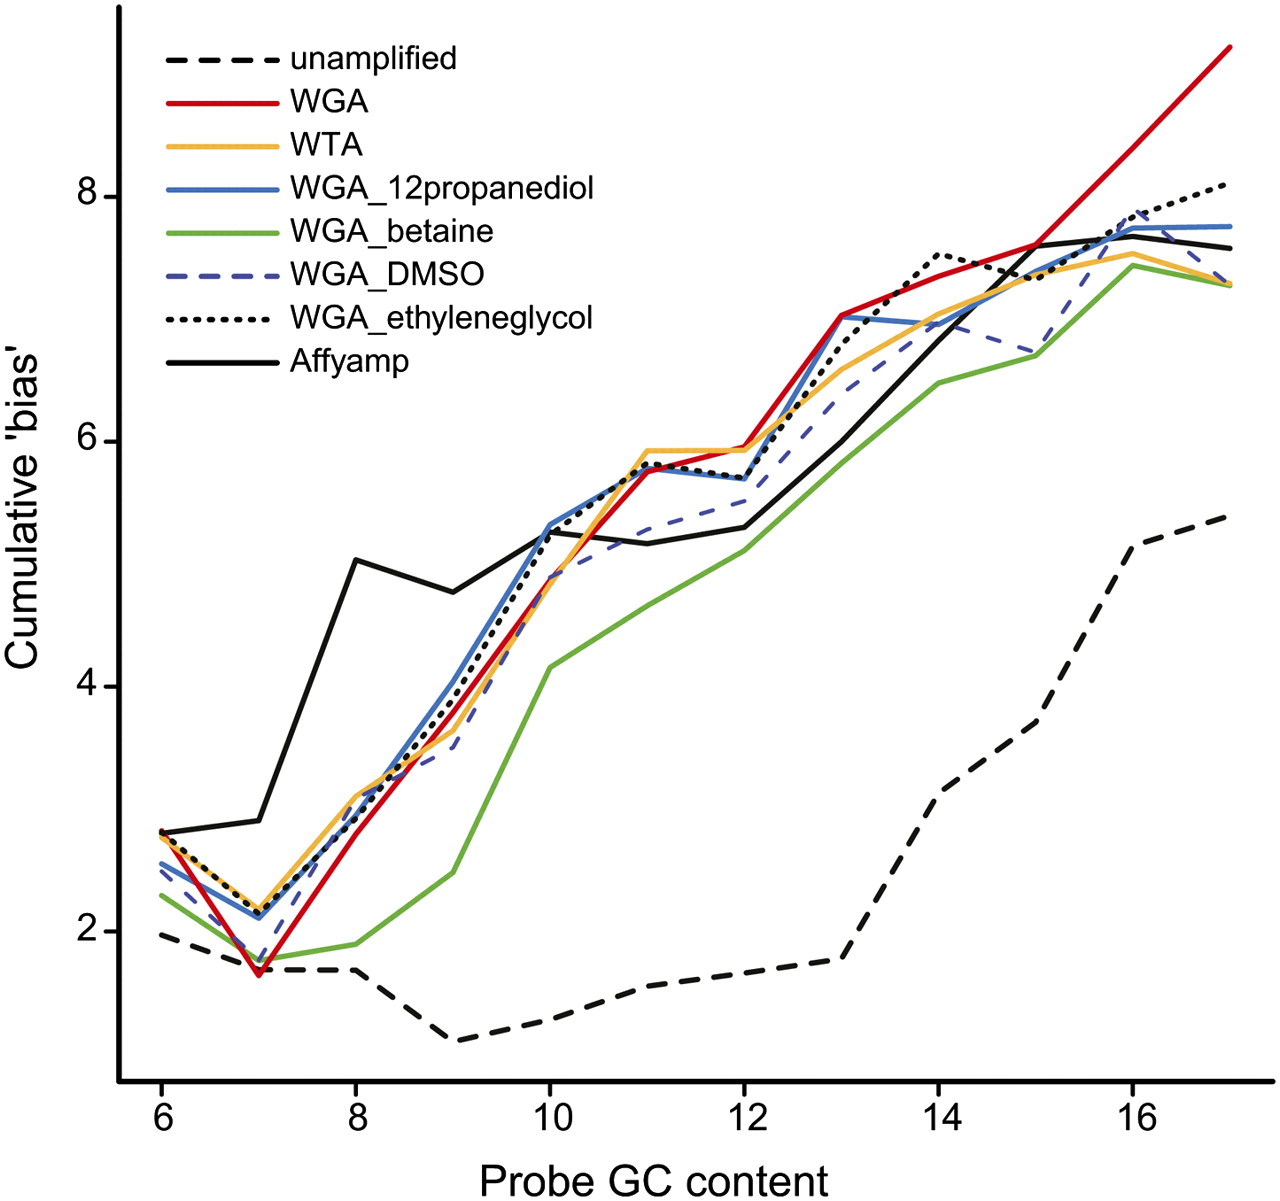
Evaluation of affinity-based genome-wide DNA methylation data: Effects of CpG density, amplification bias, and copy number variation

(Downloading may take up to 30 seconds. If the slide opens in your browser, select File -> Save As to save it.)

Click on image to view larger version.

Figure 3.
Figure 3.

Observed cumulative bias of various amplification methods. X-axis denotes the probe GC content. Y-axis denotes the cumulative bias score, which captures the cumulative signal attenuation over the 50 bins of local CpG density (for definition, see Methods). Each line represents a different amplification strategy.

This Article

  1. Genome Res. 20: 1719-1729

Preprint Server