
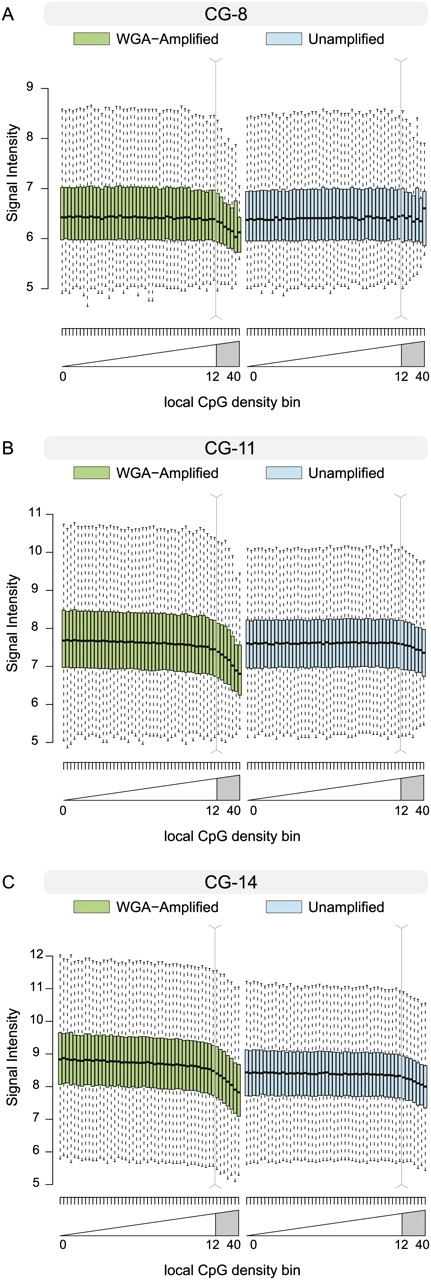
Box-and-whisker plots of unnormalized log2-scale microarray intensities for unamplified and WGA-amplified genomic DNA. To control for the association between probe GC content and intensity, probes with GC content of 8, 11, and 14 (out of 25) are shown in A–C, respectively. Plots for the remaining probe GC contents (and further experimental samples) are shown in Supplemental Figure 5. Probes are grouped into 50 equally sized bins genome-wide-based on their local CpG density, as shown in Figure 1, B and C. Box-and-whisker plots show the 25th and 75th percentile as the bottom and top of the box, and the band represents the median; the whiskers show the lowest data point within 1.5 interquartile range (IQR) of the 25th percentile and the highest data point within 1.5 IQR of the 75th percentile.


