
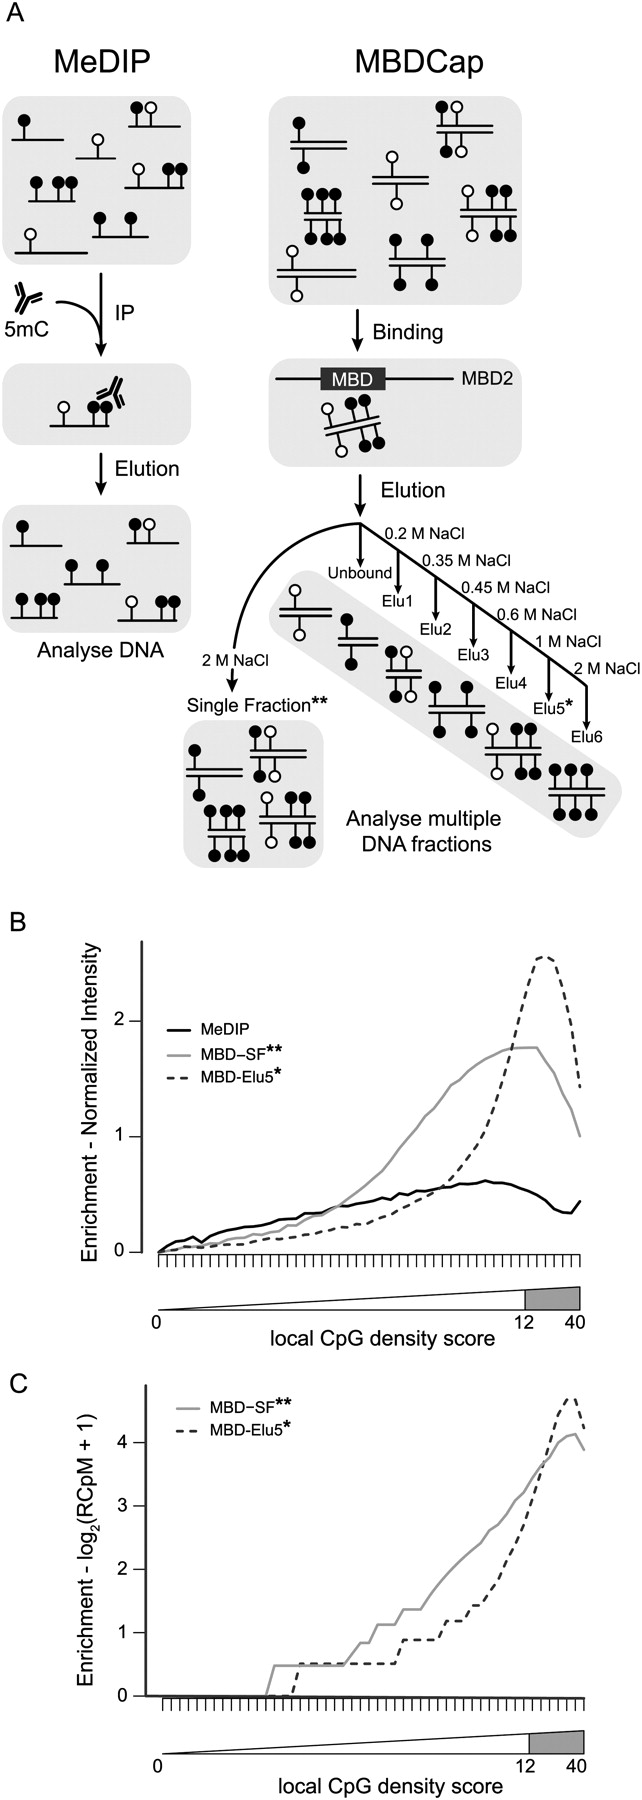
(A) Schematic showing the capture of methylated DNA into populations of single-stranded (MeDIP) or double-stranded (MBDCap) fragments. (B) Summarized probe intensities for enrichment of fully methylated DNA with MeDIP and two variations of MethylMiner-based enrichment. X-axis shows the local CpG density group (1–50). Y-axis shows the log2-scale input-normalized intensity. Each line shows the median intensity for the input-normalized intensities for the probes in the bin (here, for probes with GC content of 11 only). The intensities are further normalized such that the median in the lowest bin is 0. The location of probes within CpG islands is shown by the gray-shaded region, corresponding to a local CpG density score between 12 and 40. (C) Summarized read counts in bins of 1000 bases over the same genomic regions interrogated by the Affymetrix Promoter 1.0R array. Each line represents the median log2 read count (RCpM indicates read counts per million mapped); the summaries are normalized such that the median with the lowest bin is 0.


