
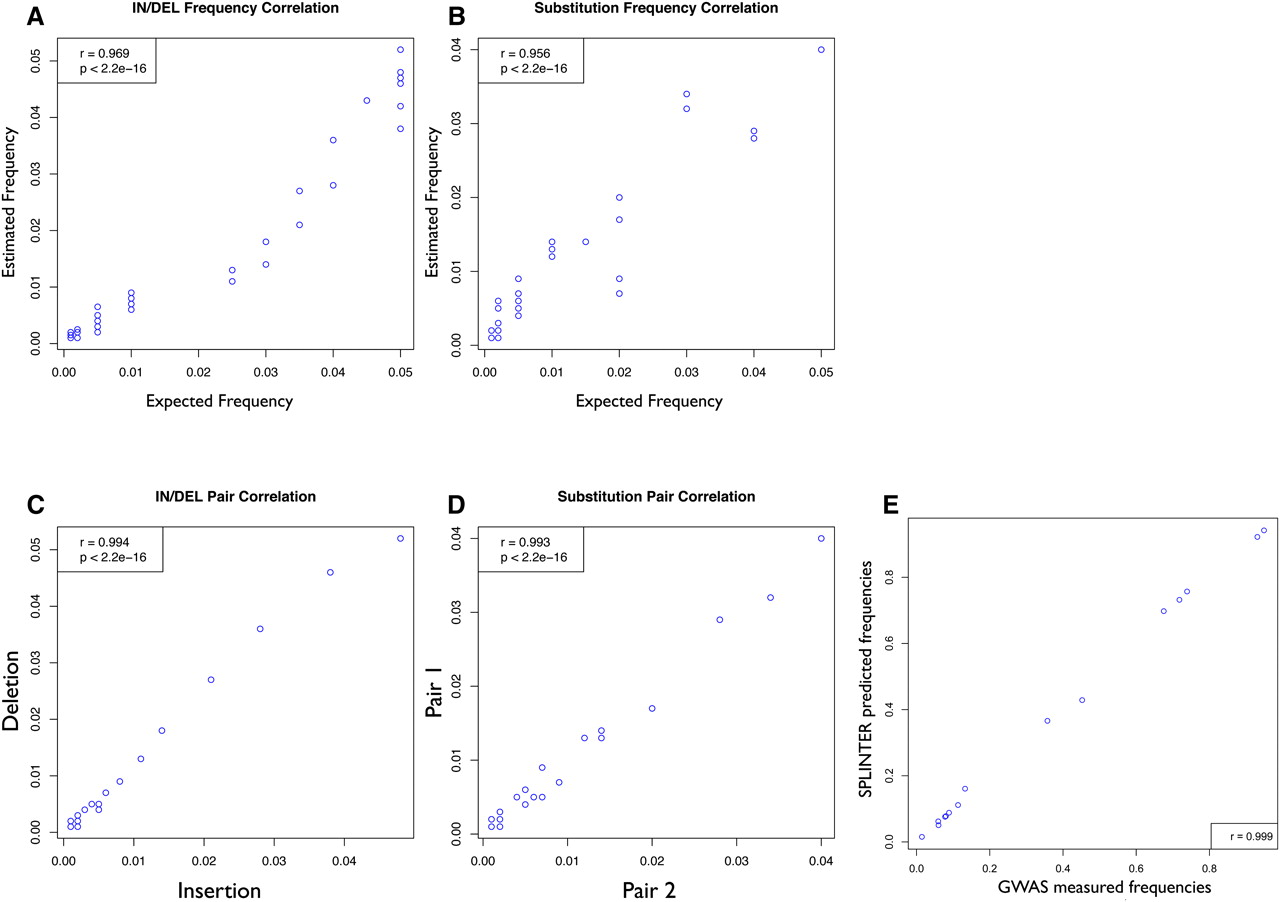
Figure 4.
Precise quantification of rare genetic variants in synthetic and real samples. (A,B) Correlation between variant frequency measured by SPLINTER (y-axis) and expected variant frequency (x-axis) from eight synthetic pools for indels (A) and substitutions (B). (C,D) Pair correlation between mutation pairs present in the same DNA molecule for indels (C) and substitutions (D). (E) Correlation between variant frequency measured from GWA study (x-axis) and SPLINTER estimated frequency (y-axis).


