
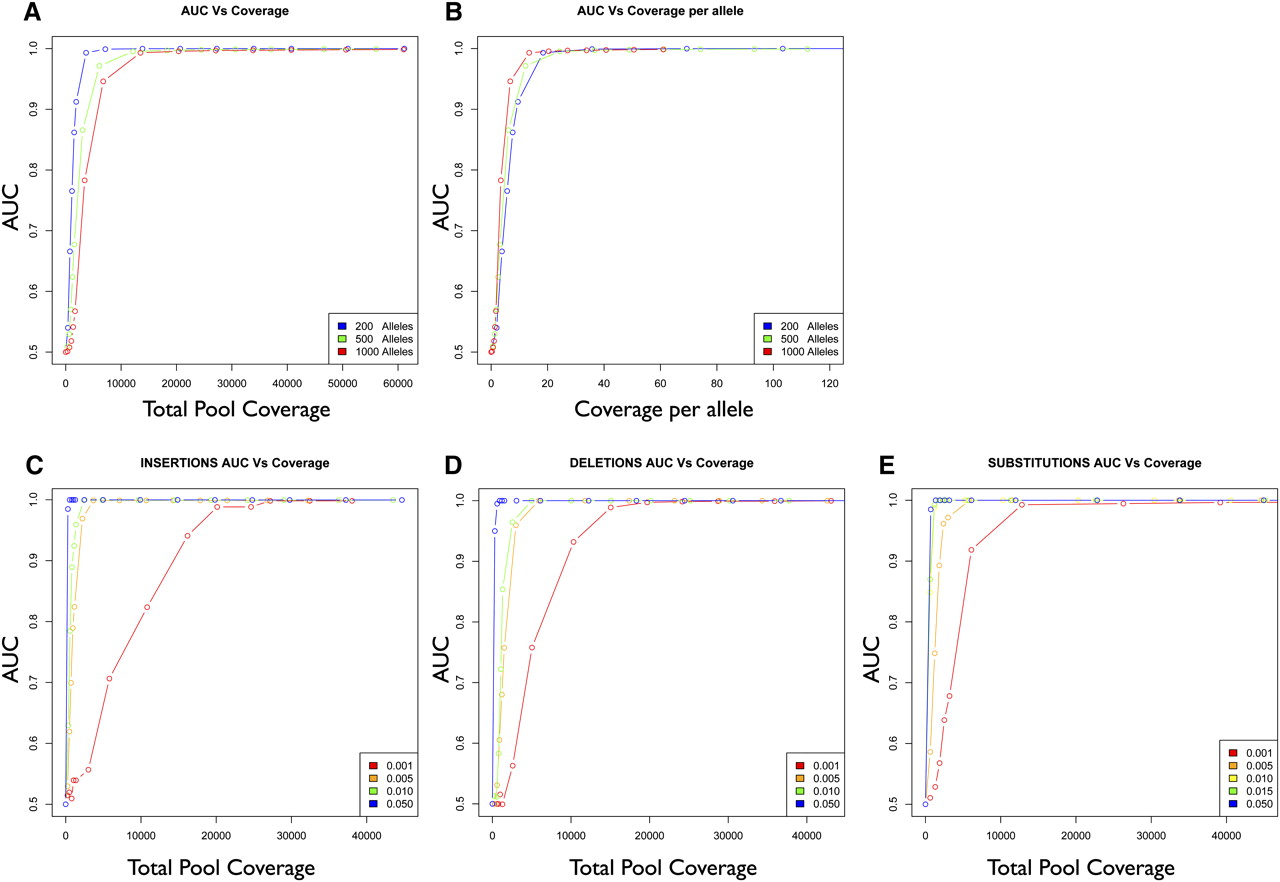
Figure 2.
Relationship between variant detection accuracy and average sequencing coverage per base. (A) Accuracy expressed as AUC (area under the curve) (y-axis) plotted as a function of average sequencing coverage per base (x-axis) for synthetic pools with variants present at frequencies 1/200, 1/500, and 1/1000. (B) Same as in A, with average sequencing coverage per base per allele on the x-axis. (C–E) AUC (y-axis) as a function of average sequencing coverage per base (x-axis) for insertions (C), deletions (D), and substitutions (E). Variants are present at frequencies 1/1000, 5/1000, 10/1000, 15/1000, and 50/1000.


