
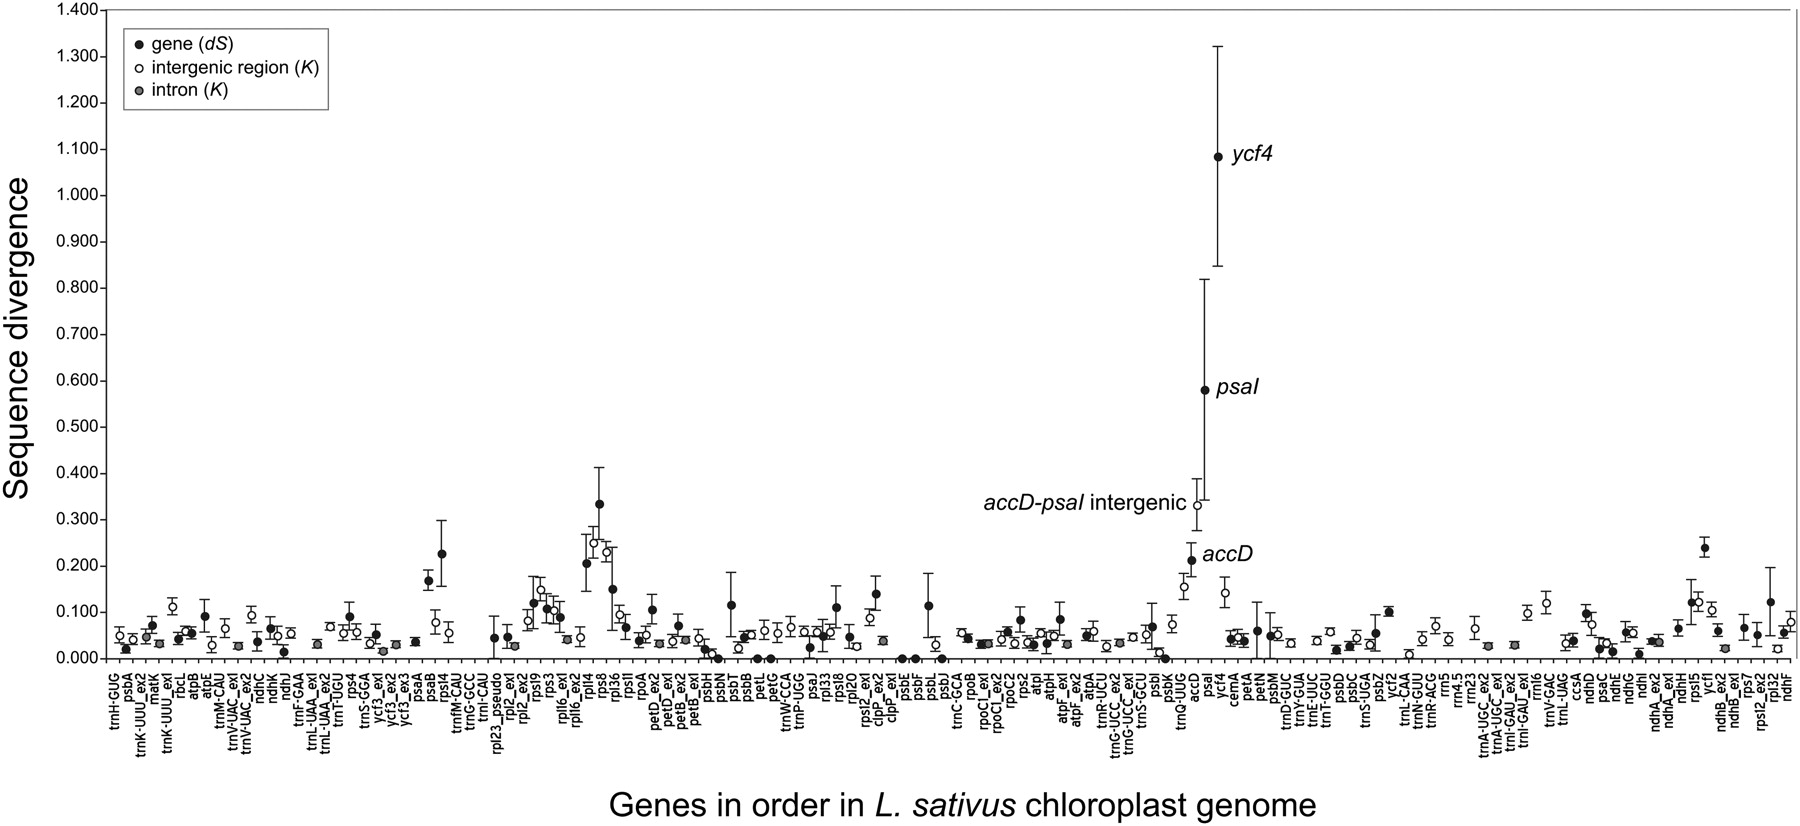
Sequence divergence between the P. sativum and L. sativus chloroplast genomes. The x-axis lists genes or exons in the order in which they occur in the L. sativus genome. Black filled circles show dS (number of synonymous substitutions per synonymous site) for each orthologous protein gene pair, calculated using yn00 (Yang 2007). White and gray filled circles show divergence (K) for each intergenic region or intron, respectively, calculated by Kimura's two-parameter method (Kimura 1983). Vertical bars, dS or K ± 1 SE. Because ycf4 is a pseudogene in P. sativum and psaI is not present in L. sativus, the dS value plotted for ycf4 is for a comparison between L. sativus and L. palustris, and the dS value plotted for psaI is for a comparison between P. sativum and L. palustris (see text). No divergence values are plotted for intergenic regions that are not flanked by the same genes in the two species or that are shorter than 100 bp.


