
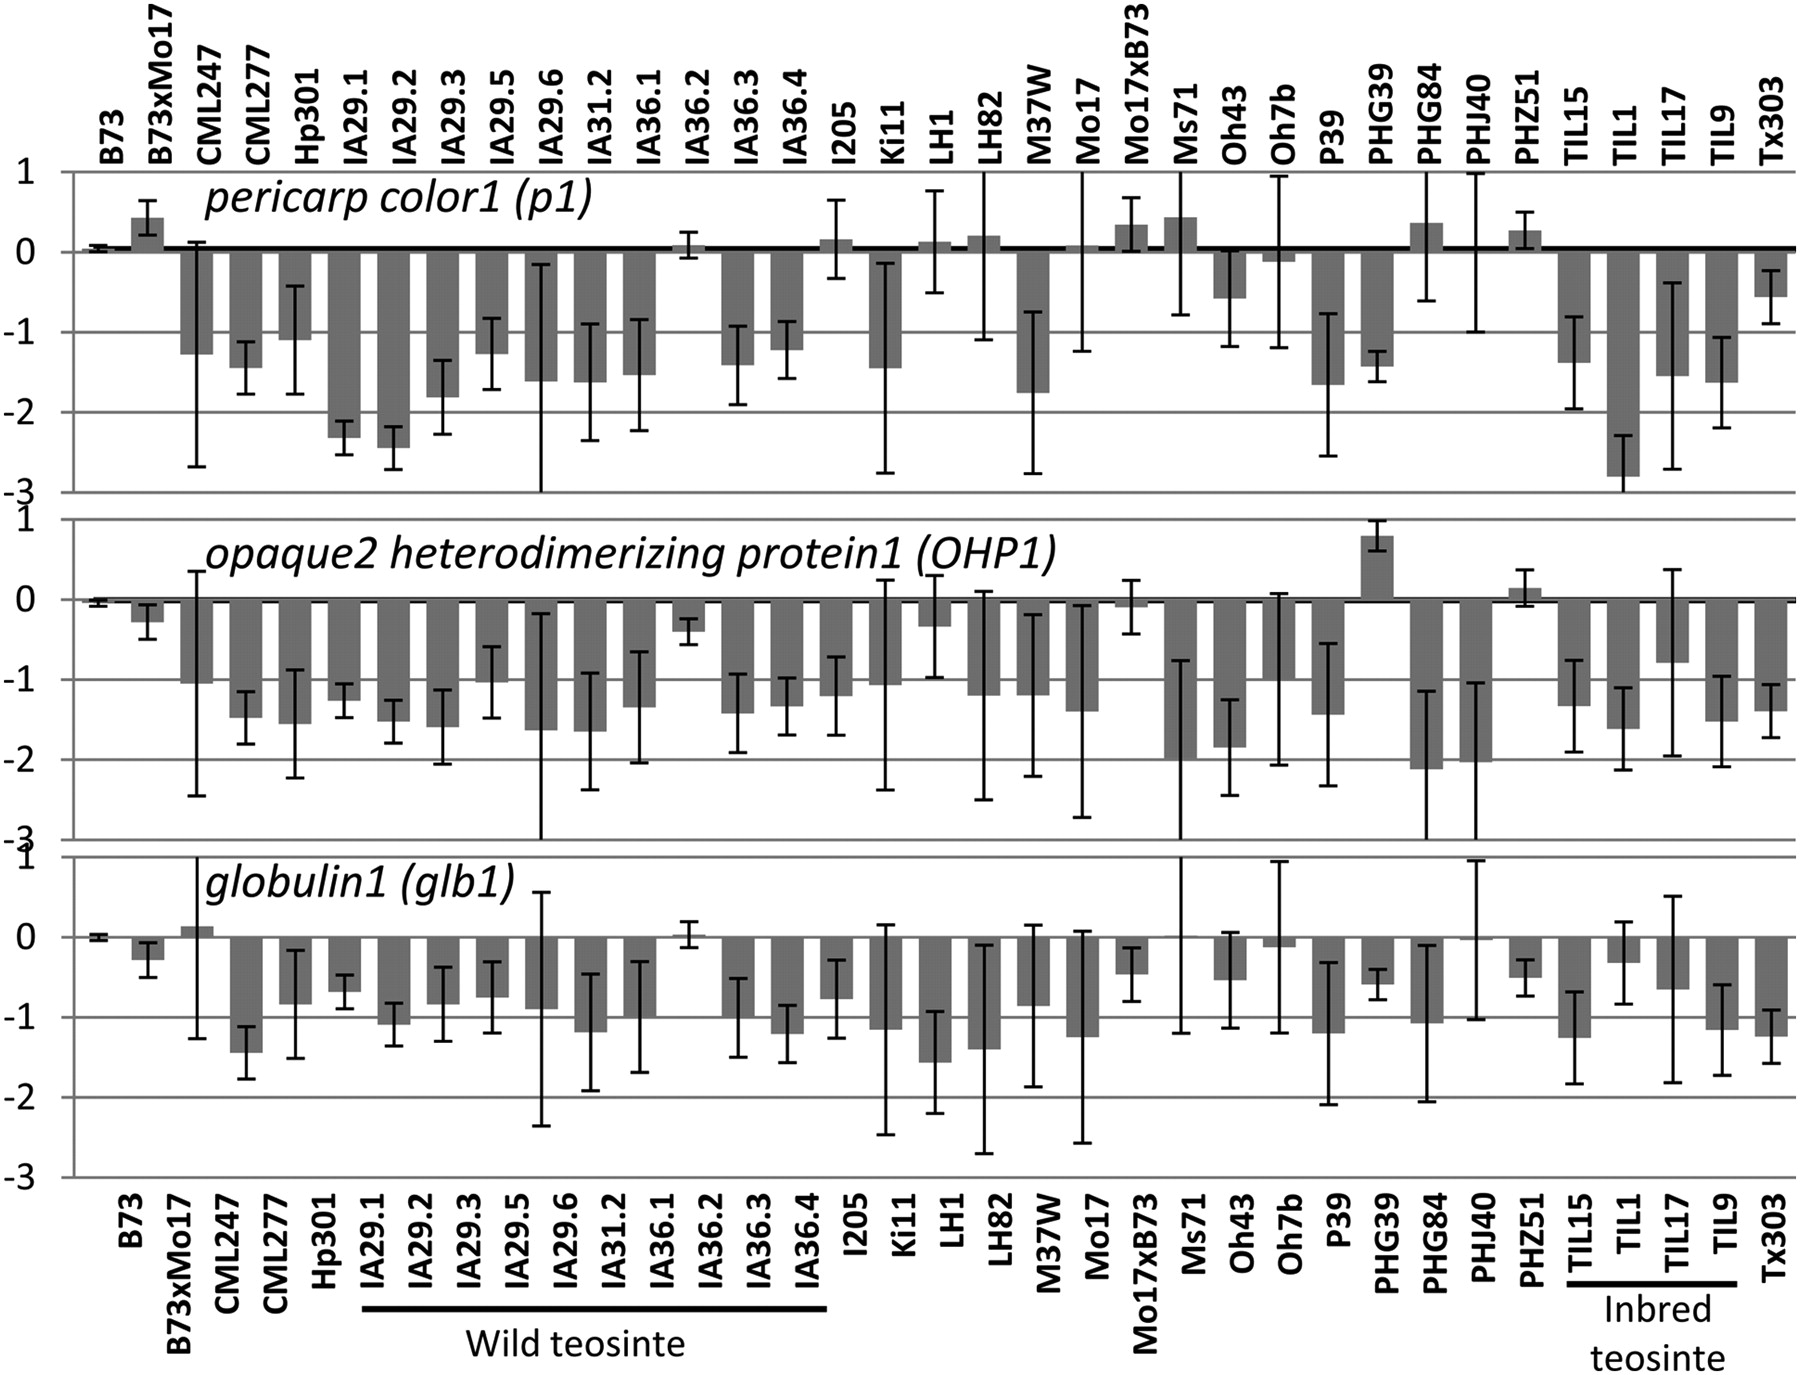
Figure 5.
Examples of CNV for previously characterized maize genes. The CGH data are summarized for three maize genes. For each genotype the average log2 ratio for all probes from the gene is summarized as the height of the bar, and the standard deviation for the multiple probes is represented by the error bars.


