
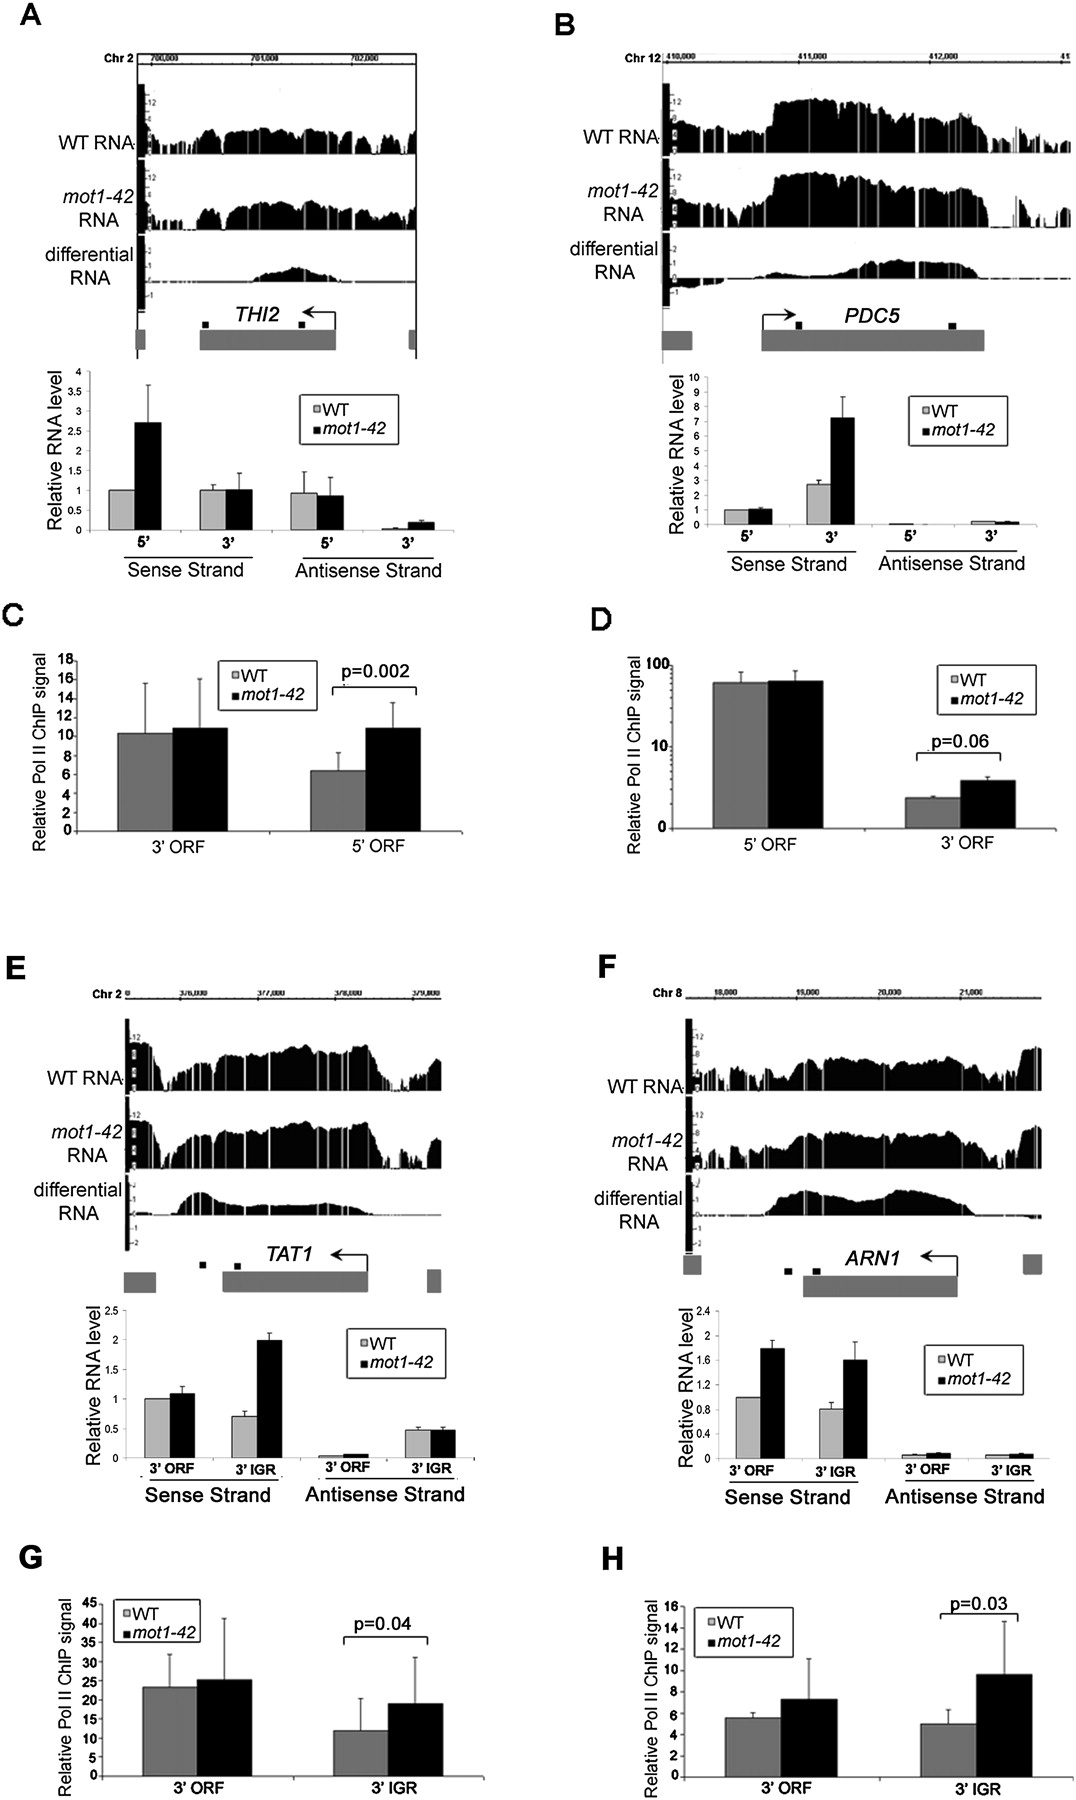
Confirmation of cryptic initiation and 3′ transcript length changes in mot1-42 cells. (A,B,E,F) Screenshots of log2 WT, mot1-42, and differential RNA levels for four selected genes are shown in the upper part of each panel. Relative RNA levels quantified by real-time PCR using sense- and antisense-specific primers are shown in the bar graphs. The graphs show the average ± SE obtained by analysis of two independent RNA samples for each strain. The small black boxes above each gene indicate the locations of each primer set. (C,D,G,H) Relative RNA Pol II ChIP signals were obtained at the 5′ end and the 3′ end of the ORF (THI2 and PDC5) or the 3′ end of the ORF and the 3′ intergenic region (TAT1 and ARN1). The results were obtained using the 8WG16 antibody and are shown as the mean of three biological replicates ± SD. The indicated P-values were determined using a one-tailed paired t-test of the log-transformed ChIP values. The same primer sets were used as the RNA analysis. THI2 is an example of prematurely terminated RNA, and PDC5 is an example of downstream initiation. In contrast, TAT1 and ARN1 are examples of downstream termination RNAs. For all of the genes, there is an increase in Pol II ChIP levels that correspond with the RNA length change. Note that the Pol II ChIP data for PDC5 are shown on a log scale. The strong signal at the 5′ end of the PDC5 ORF is consistent with previously published data (Steinmetz et al. 2006).


