
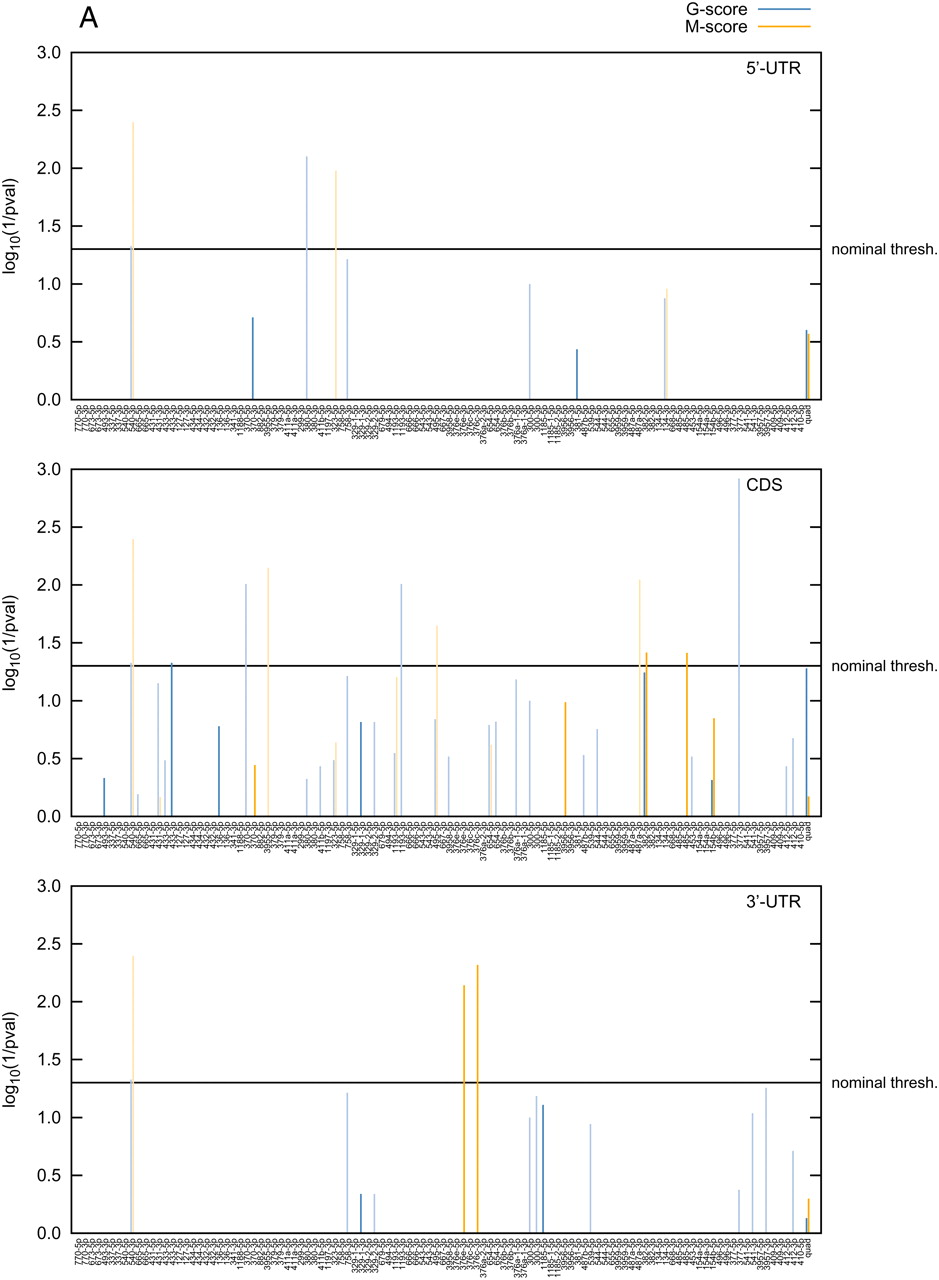
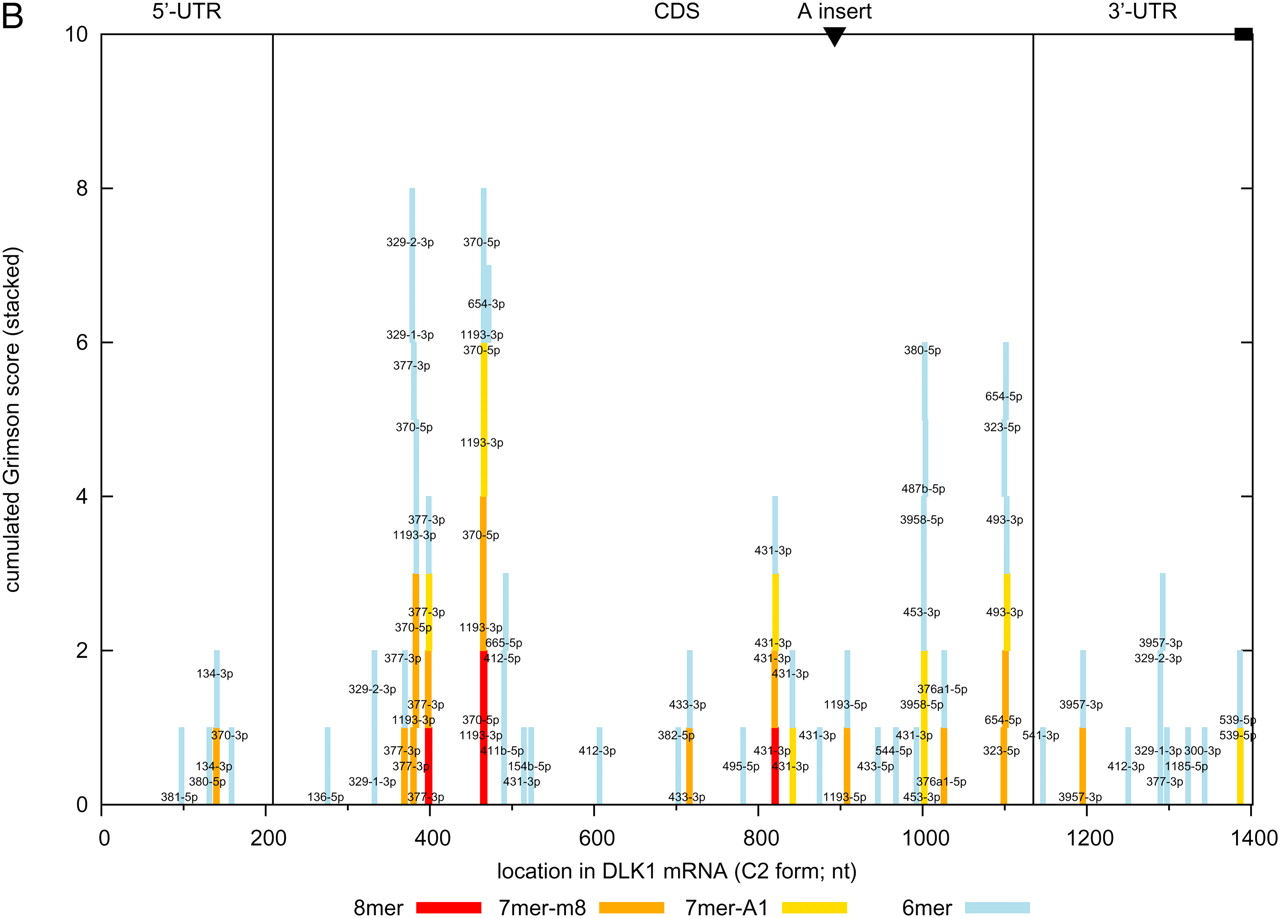
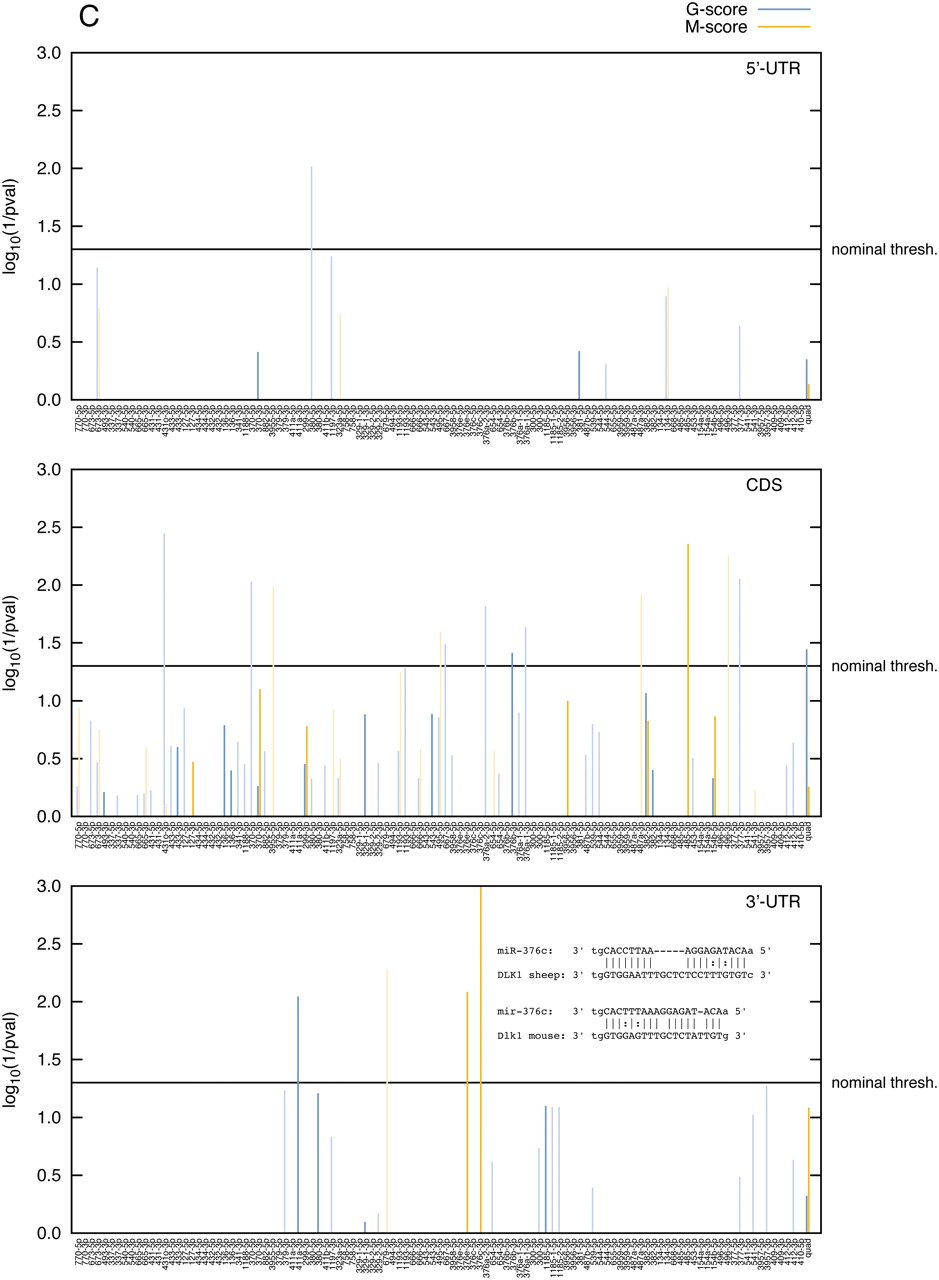
(A) Statistical significance [log(1/p)] of the affinity of ovine miRNAs in the DLK1–GTL2 domain for the 5′-UTR, coding sequence (ORF), and 3′-UTR of the ovine DLK1. The affinity was measured using either G- (blue) or M-scores (orange) as defined in the text. Bars are dark colored for highly expressed and light colored for lowly expressed miRNAs. The last pair of bars (“quad”) at the right of the graph corresponds to the quadrille scores, the remaining bars to the species scores and are labeled accordingly. P-values were determined using the sequence-shuffling test described in the text. Species scores require a Bonferroni correction for 127 independent tests. (B) Position in the DLK1 mRNA of target sites (8-mers, 7-mers, and 6-mers as defined by Grimson et al. [2007]) for the same set of miRNA species. (C) Same as in A except that the scores are “multiorganism (MO) scores” combining information from sheep, human, and mouse.


