
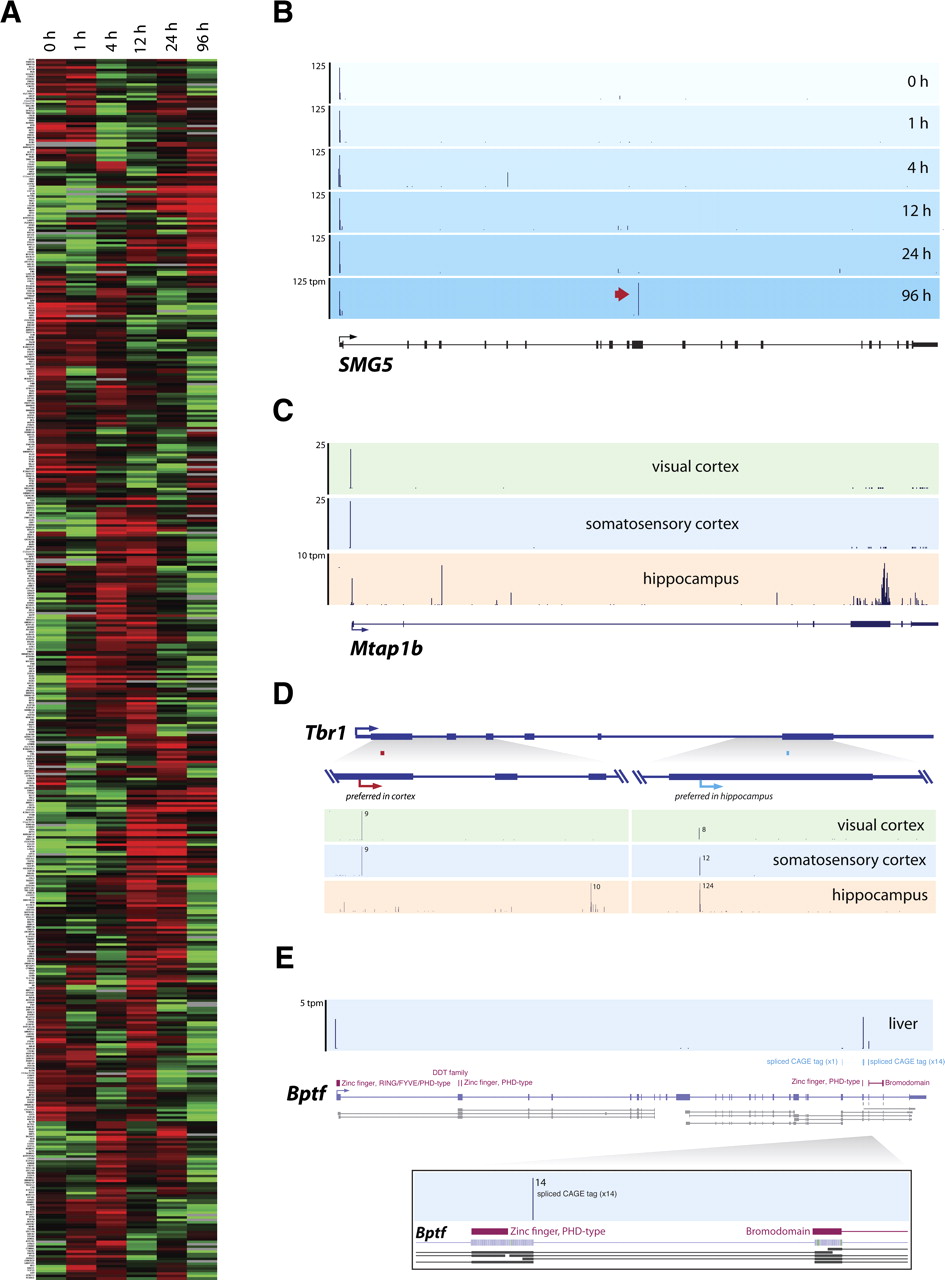
Tissue-specific cleavage events. (A) Cluster analysis of the expression of the 500 genes containing the highest exonic CAGE tag frequency shows the up-regulation (red) and down-regulation (green) of mRNA cleavage in human THP-1 cell differentiation. Expression level was determined as the normalized CAGE tag frequency mapping to coding exons. (B) Genome Browser view of human SMG5 gene with CAGE tag mapping (blue panels) across different THP1 time points shows specific cleavage event (red arrow) at 96 h post-PMA-stimulation. (C) Mouse Mtap1b gene showing CAGE tags mapping in the visual (green panel), somatosensory (blue panel) cortex, and hippocampus (beige panel). (D) Mouse Tbr1 gene shows alternative exonic CAGE tag locations preferred between the visual and somatosensory cortex (red arrow) and the hippocampus (blue arrow). (E) CAGE tags mapping (blue panel) to Bptf (violet bars) bisect distinct encoded protein domains (purple bars), potentially generating alternative protein-coding isoforms. (Tpm) Tags per million.


