
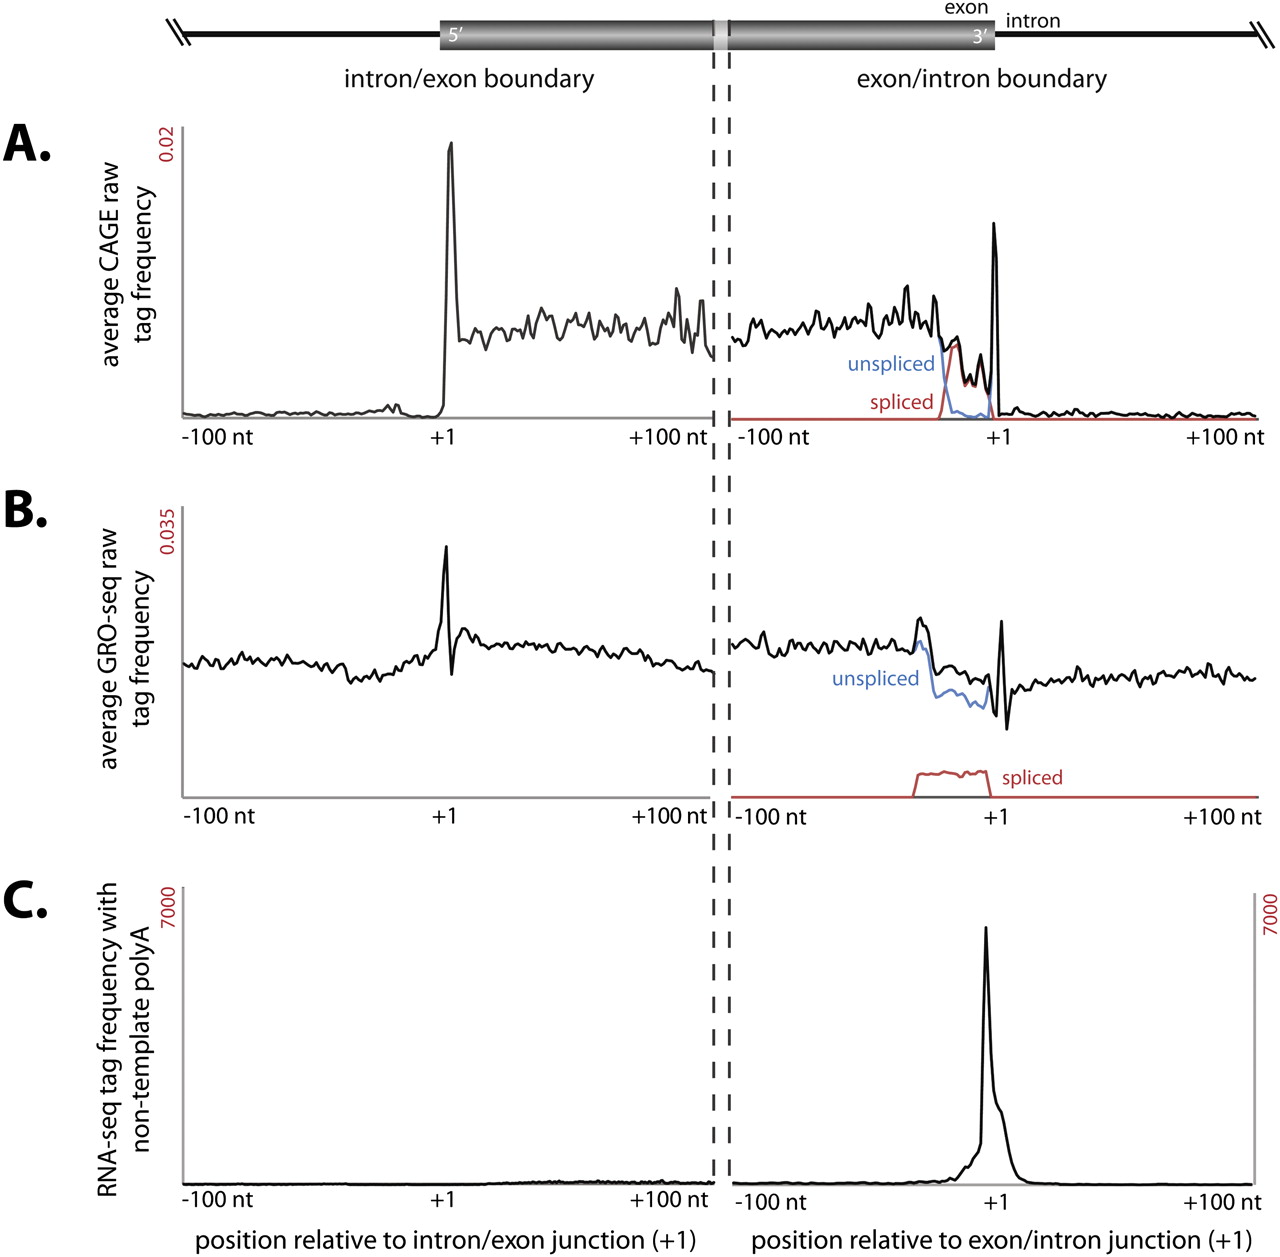
Figure 5.
Distinct class of exonic CAGE tags associated with splice junctions. (A) Average CAGE tags frequency distribution within a 200-nt window centered on splice junctions (indicated at +1) shows a distinct enriched peak immediately downstream from the intron–exon junction (first column) and exon–intron junction (second column). (B) Distribution of GRO-seq tags derived from nuclear run-on (Core et al. 2008) across splice junctions peak immediately downstream from the intron–exon junction and exon–intron junction. (C) Cumulative frequency distribution of polyadenylated RNA deep-sequencing tags from mouse brain (Parkhomchuk et al. 2009) across exon–intron splice junctions.


