
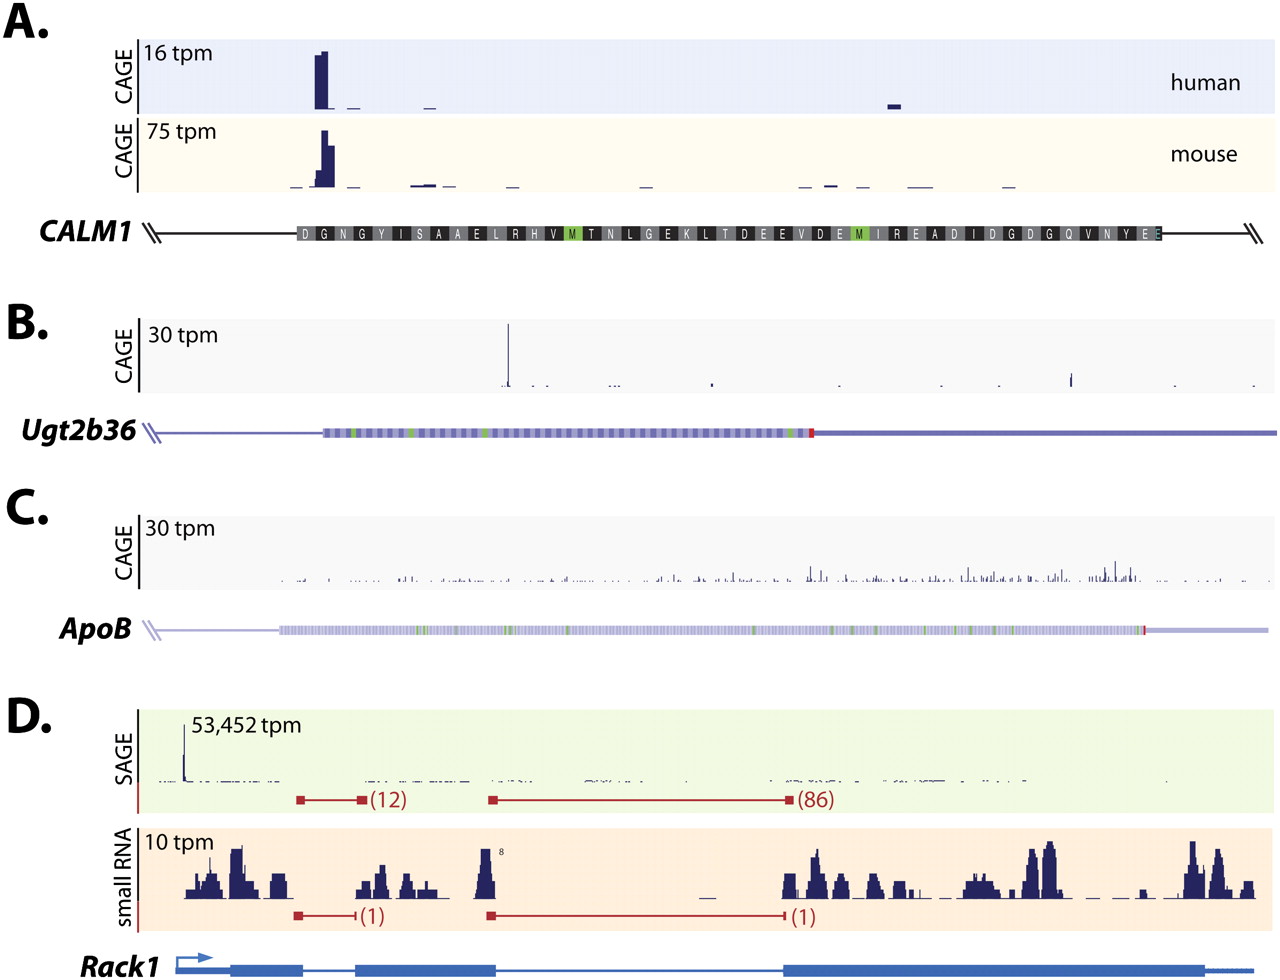
Figure 2.
Illustrative examples of post-transcriptional cleavage in human and mouse. (A) Exonic CAGE tags map to syntenic nucleotides in the human (blue panel) and mouse (beige panel) CALM1 gene. (B) Single peak distribution of exonic CAGE tags in the mouse Ugt2b36 gene. (C) Broad peak distribution of exonic CAGE tags in the mouse Apob gene. (D) Exonic SAGE tags (green panel) and small RNA tags (beige panel) map to the exon (black histogram) and across exon–exon junctions (red; tag count indicated) in the fly Rack1 gene (blue). (tpm) Tags per million.


