
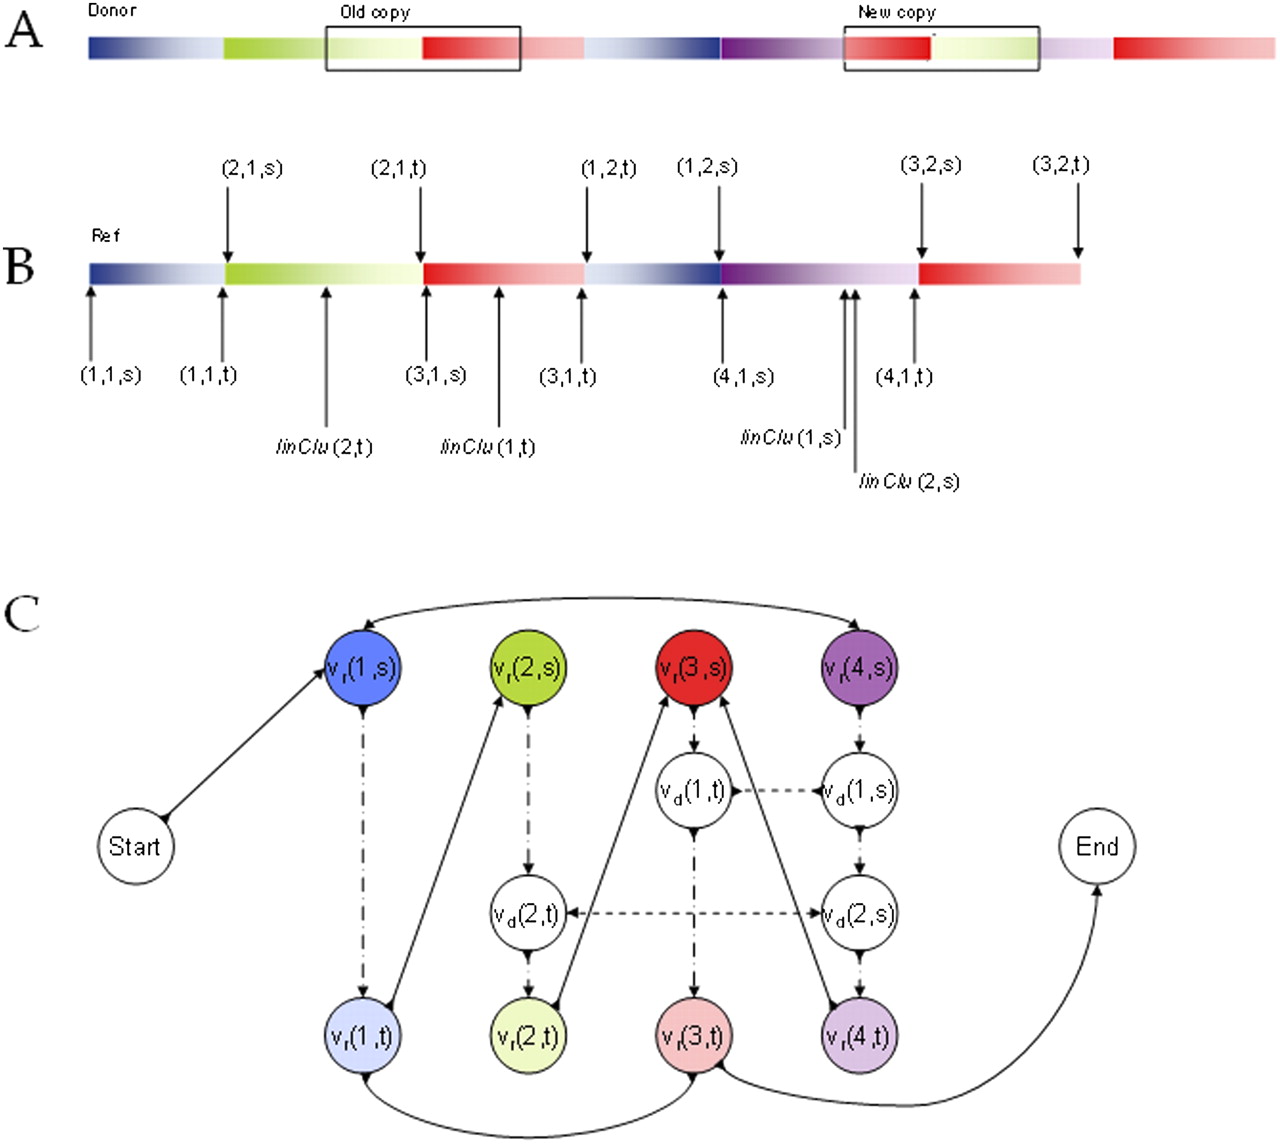
Donor graph. We show a toy example of a donor genome (A) and a reference (B). Identical regions have the same color, with inversions having a reverse color gradient. The donor differs from the reference only in that there is one nontandem inverted duplication, as shown in A. (B) The partitioning of the reference, indicated by triplets; for example, (3,1,s) refers to the location of the s endpoint of the first region of the third block. There are four blocks in the partition: blue (1), green (2), red (3), and violet (4). There are two regions in the blue block, each with different directionality; and there are two regions in the red block, with the same directionality. There are also two linking clusters, and their s and t endpoints are indicated by linClu. It is not illustrated, but cluster 1 is of type [++] and cluster 2 is of type [−−]. It is easy to check that the two linking clusters correspond with the duplication in the donor, both in their location and their type. (C) The donor graph. There are two special Start and End vertices, signifying the start and end of the genome. The other uncolored vertices are the donor vertices; the colored vertices are the partition vertices, with the darker color representing the s endpoints and the lighter the t endpoints. Sequence edges are shown with long dashed lines, donor edges with short dashed lines, and reference edges with regular lines.


