
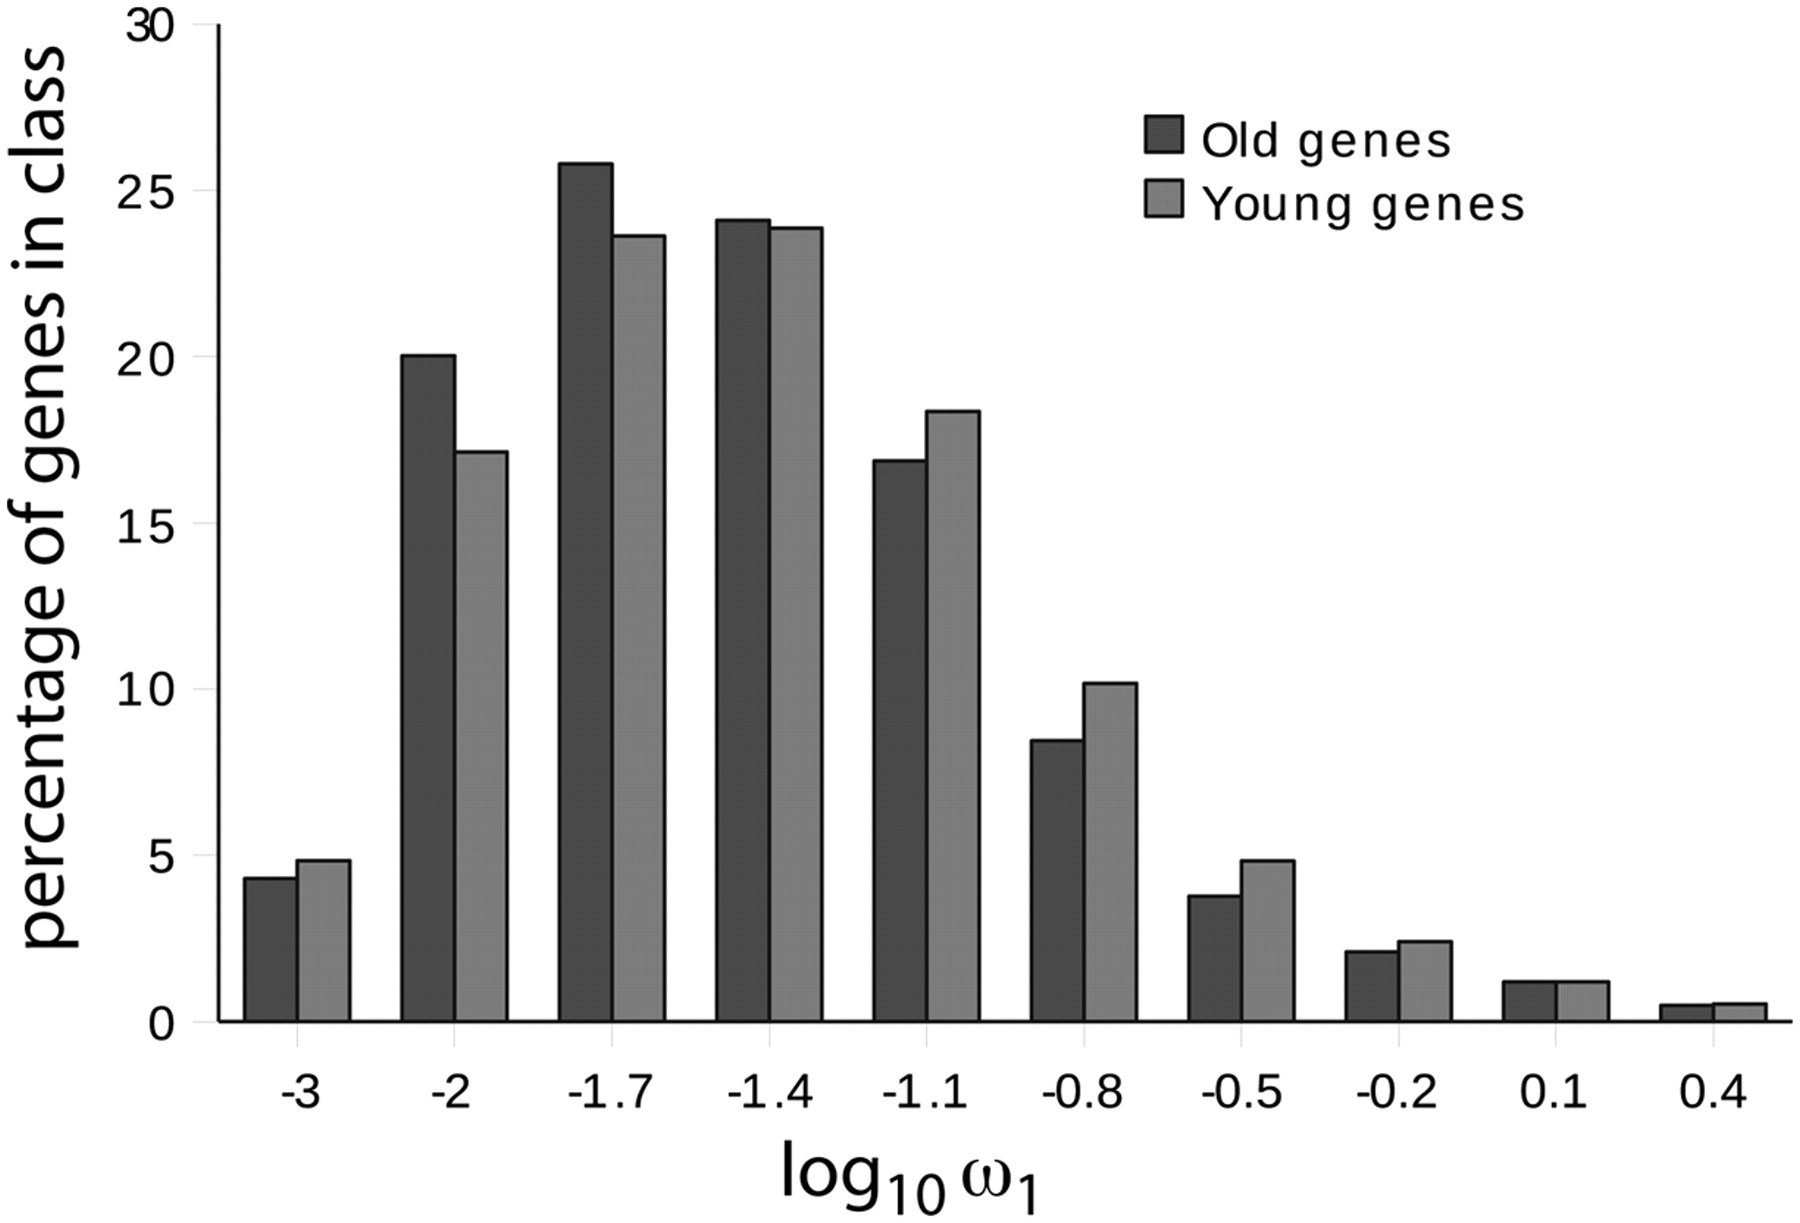
Figure 3.
The distribution of dN/dS values (ω1) among old and young mammalian genes. The old genes are skewed toward lower dN/dS values, but there is a substantial overlap. When comparing old and young genes we control for this bias by analyzing a subset of old and young genes with the same distributions of ω1 values.


