
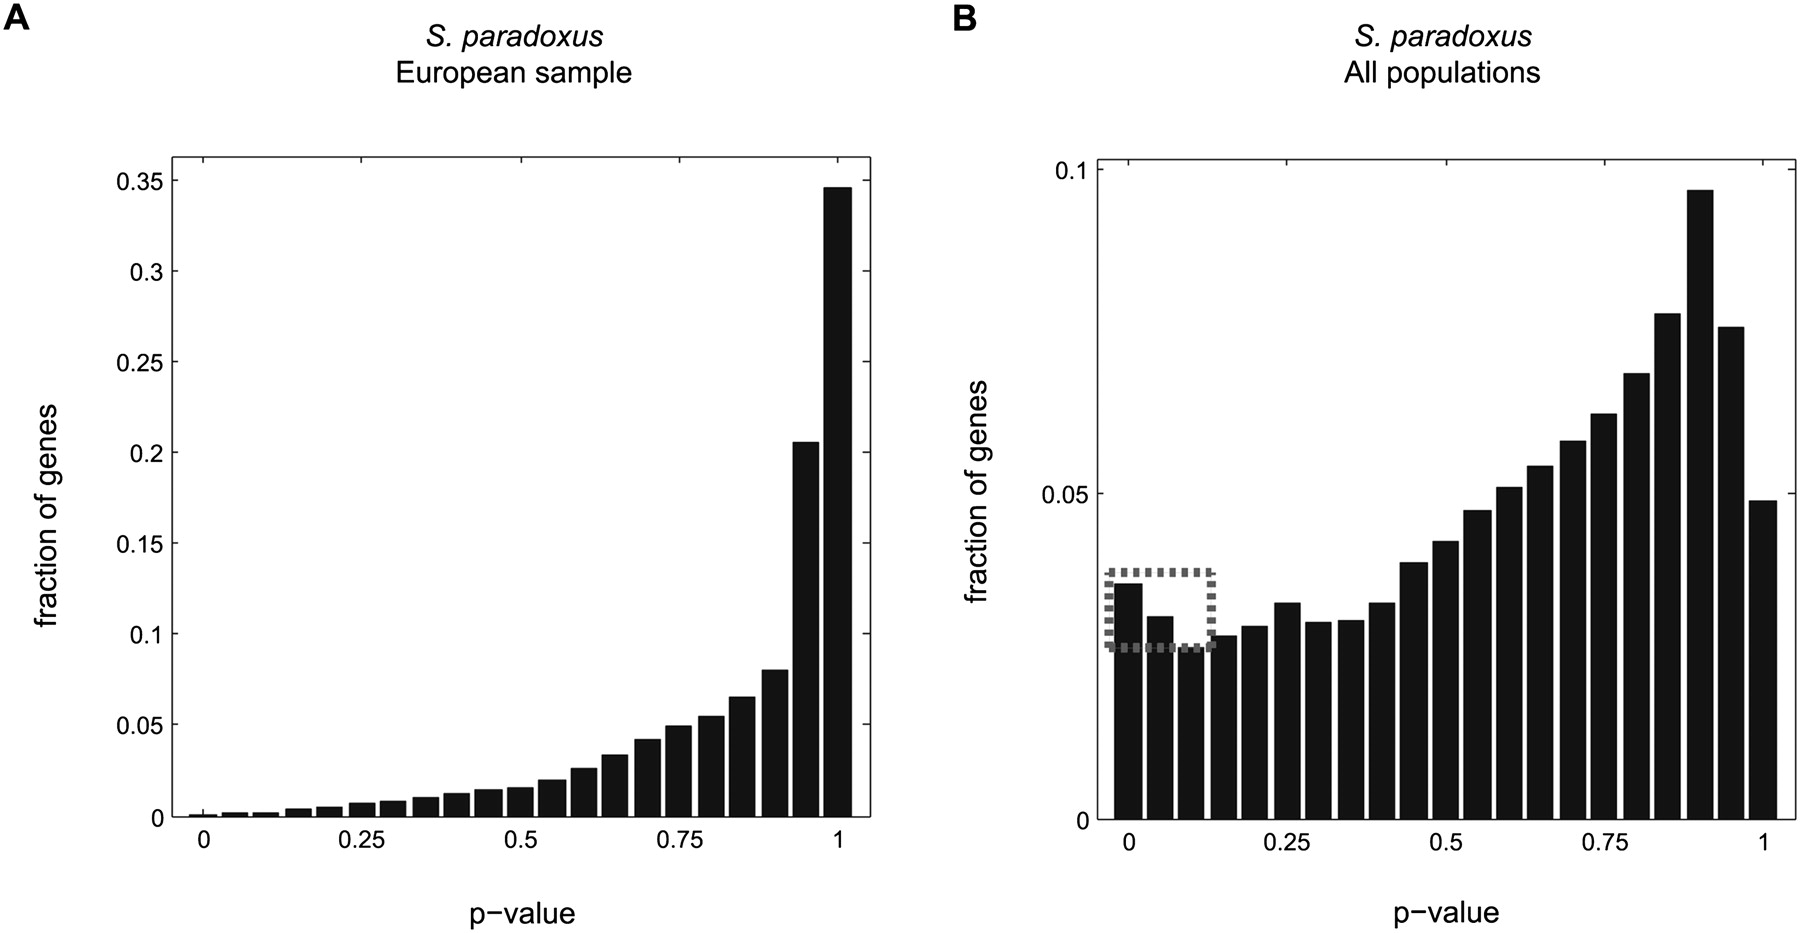
Histograms of P-values across 1727 genes obtained for the McDonald-Kreitman test based on SNP data in S. paradoxus, using two different sampling strategies. P-values for each gene were classified into 20 bins of width 0.05, and smoothed using LOWESS (Cleveland and Devlin 1988). Note that we used a different scale on the y-axes of the two histograms. While near 0, no excess of P-values is observed using SNPs segregating in the European sample (A), such an excess (highlighted by the dashed rectangle) is observed using SNPs from the entire population sample (B). This excess provides evidence for the existence of genes that experienced adaptive evolution, and allows us to estimate a lower bound on their number.


