
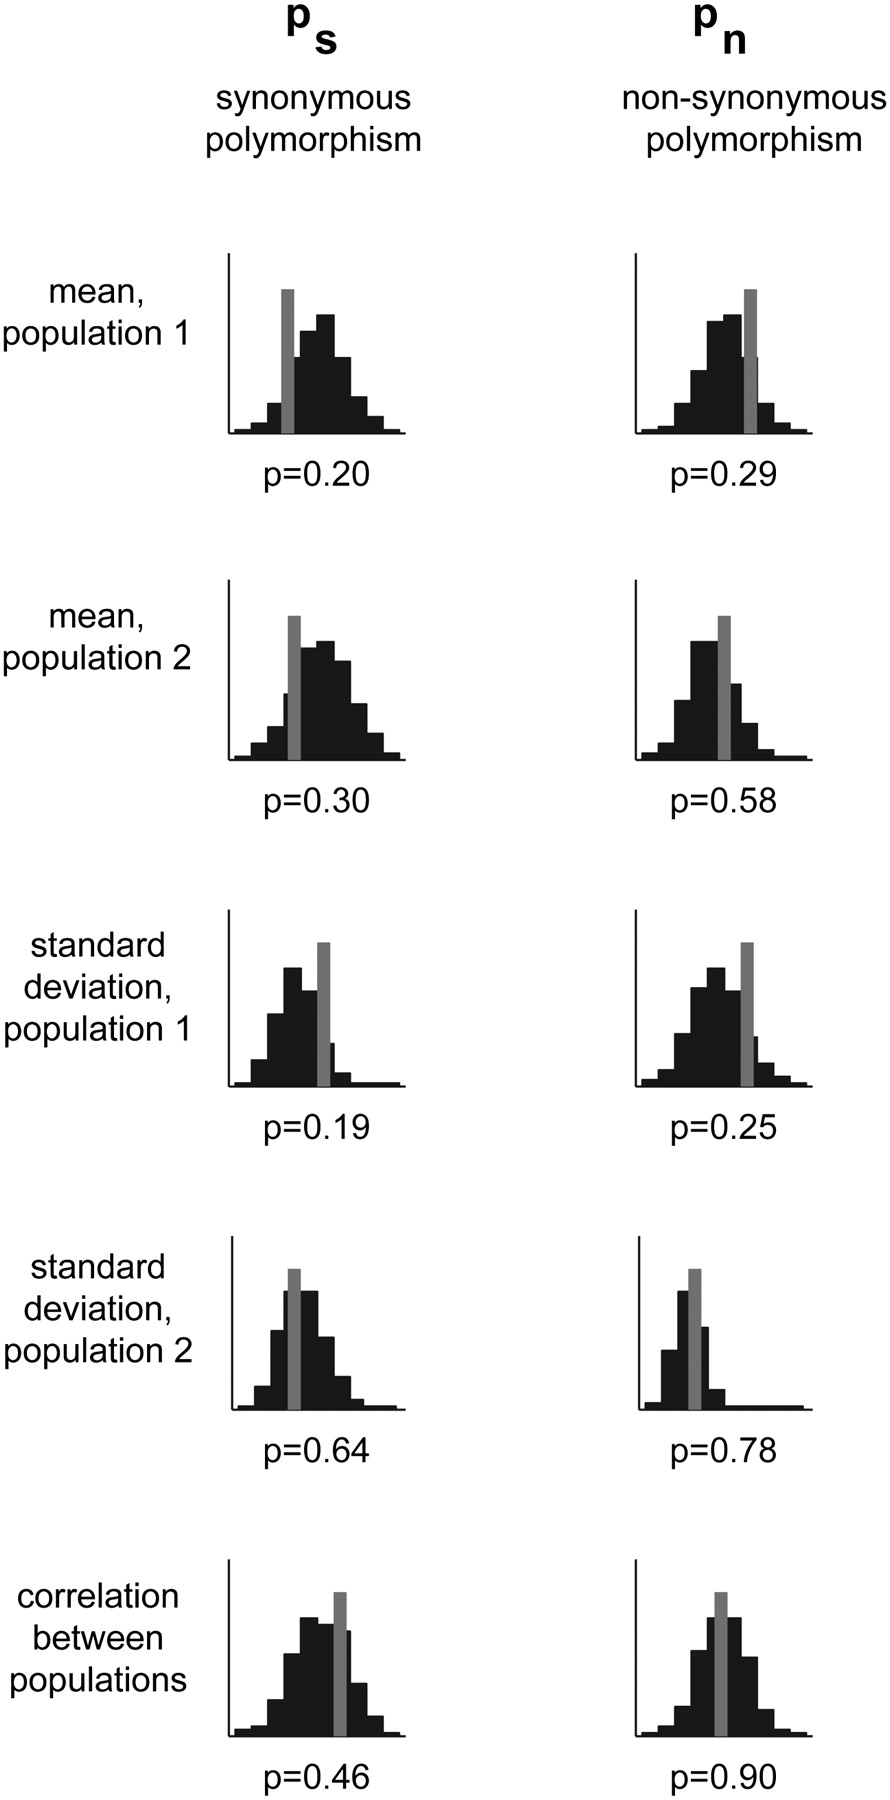
Testing the fit of the model for the European populations of S. cerevisiae and S. paradoxus. We compared five summaries of the distribution of observed synonymous polymorphism levels, pS, and nonsynonymous polymorphism levels, pN, to what is expected under the model with the ML-parameter estimates (based on 1000 simulated data sets; gray lines are the observed; black bars are the histogram of simulated values). Shown are results for the mean and standard deviation in each population as well as the correlation between the two populations; below each histogram are the P-values associated with the observed values. Similar fits were obtained for the other pairs of populations (Supplemental Table 2).


