
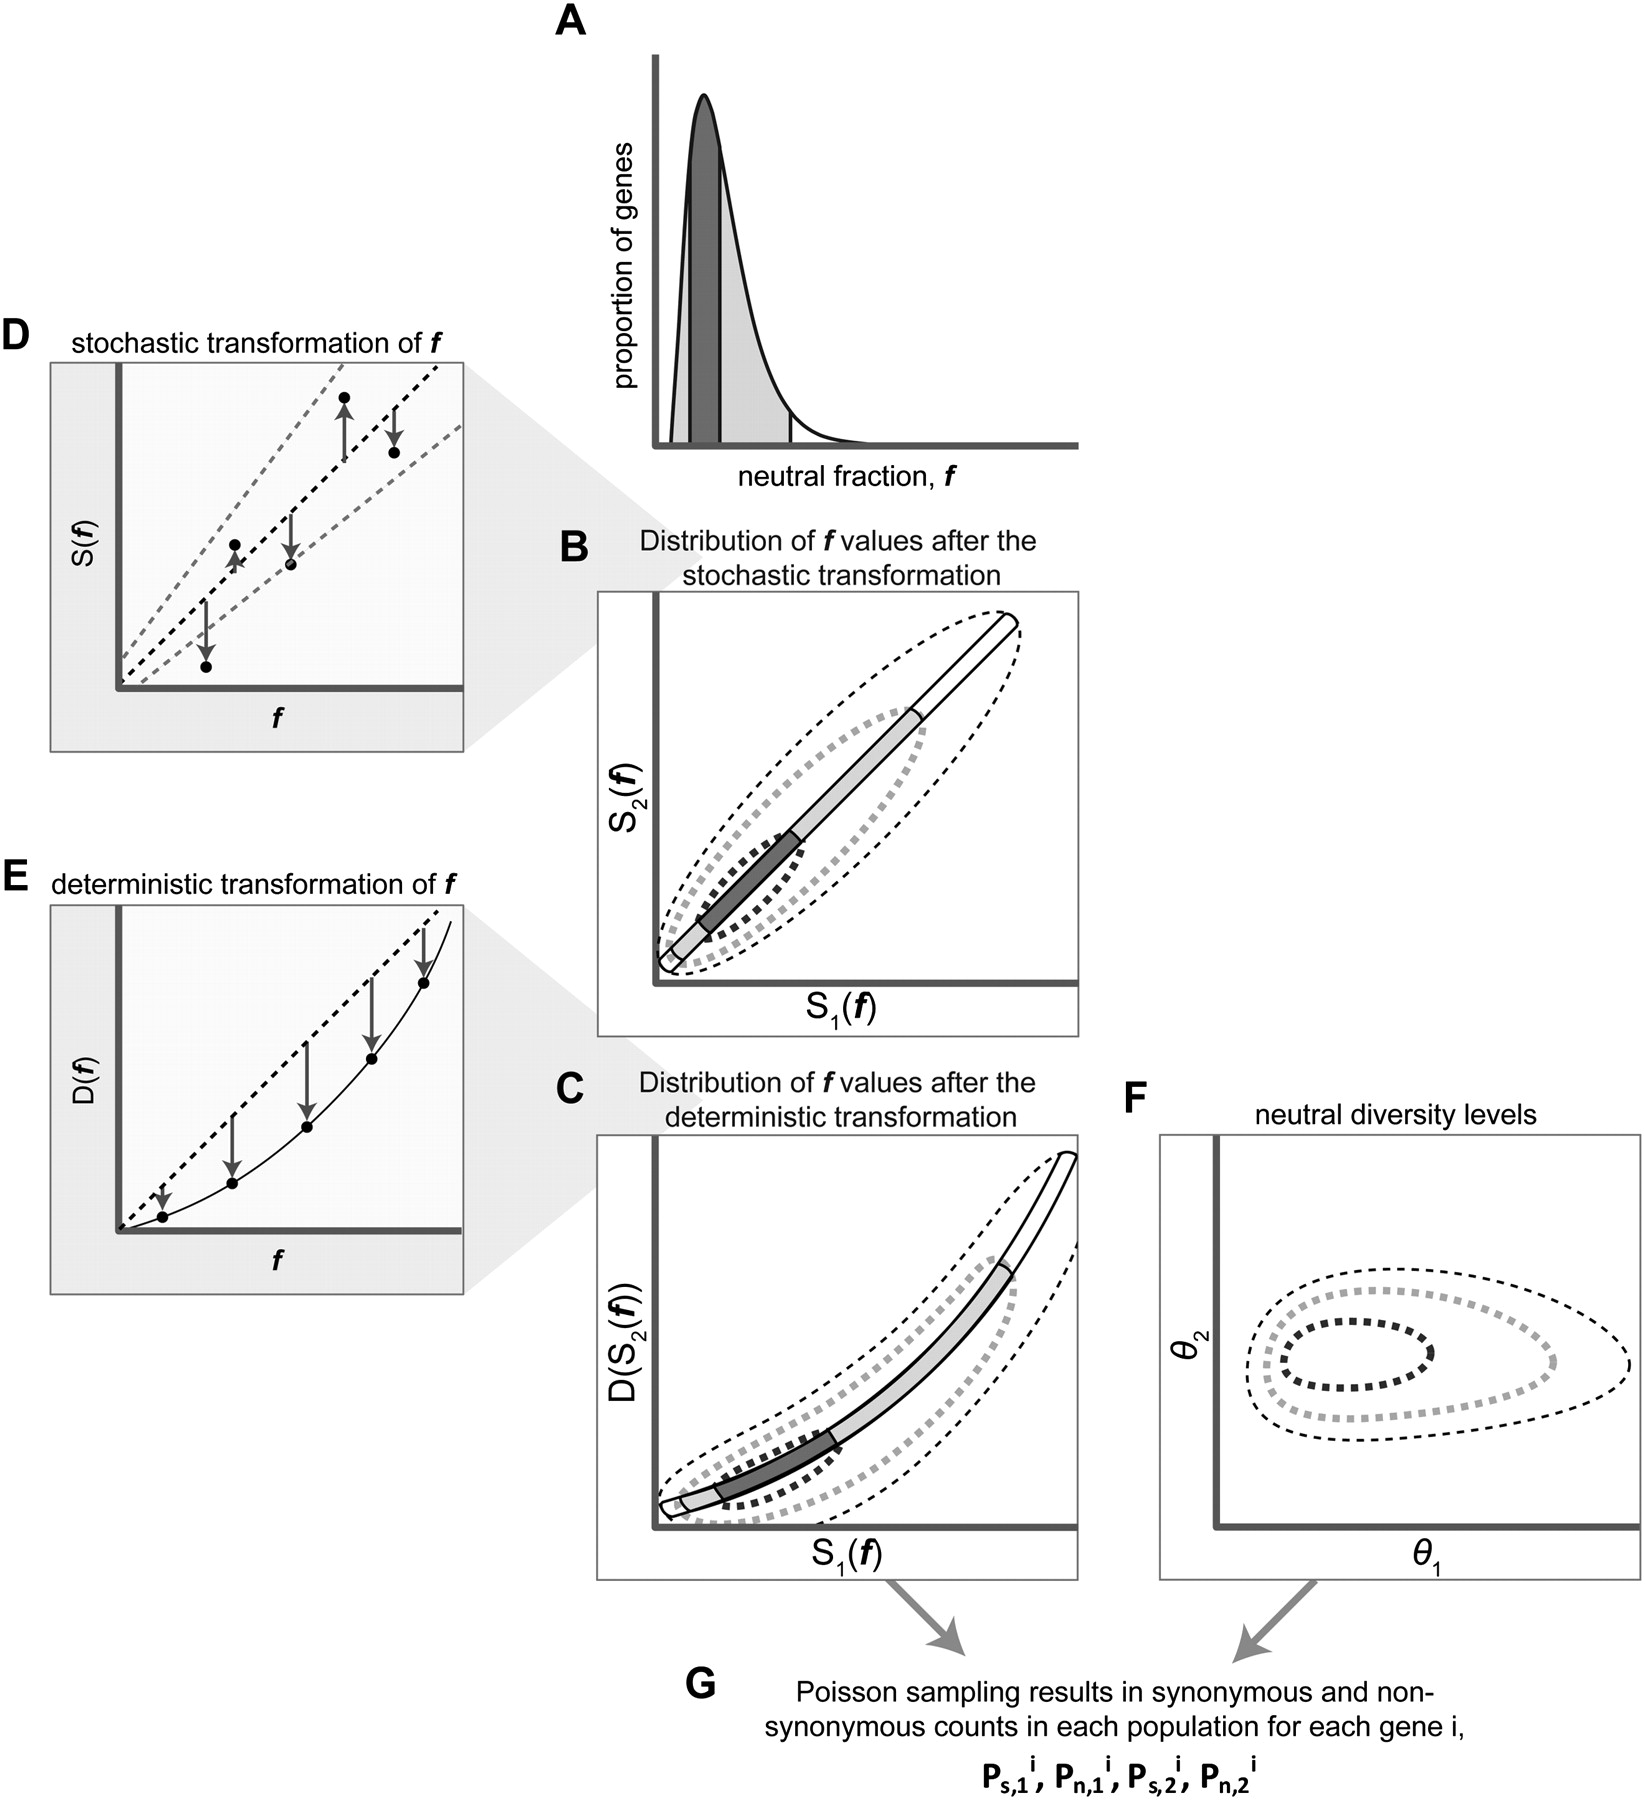
Figure 3.
Our model for shifts between two populations in the intensity of purifying selection on a gene. See text for details. Subindices 1 and 2 refer to population 1 and 2, respectively. S(f) denotes the stochastic transformation and D(f) the deterministic transformation. Dark gray represents the central 50th percentiles of the probability mass, and light gray represents the central 95th percentiles. The arrows in D and E represent the values of f before and after the transformation.


