
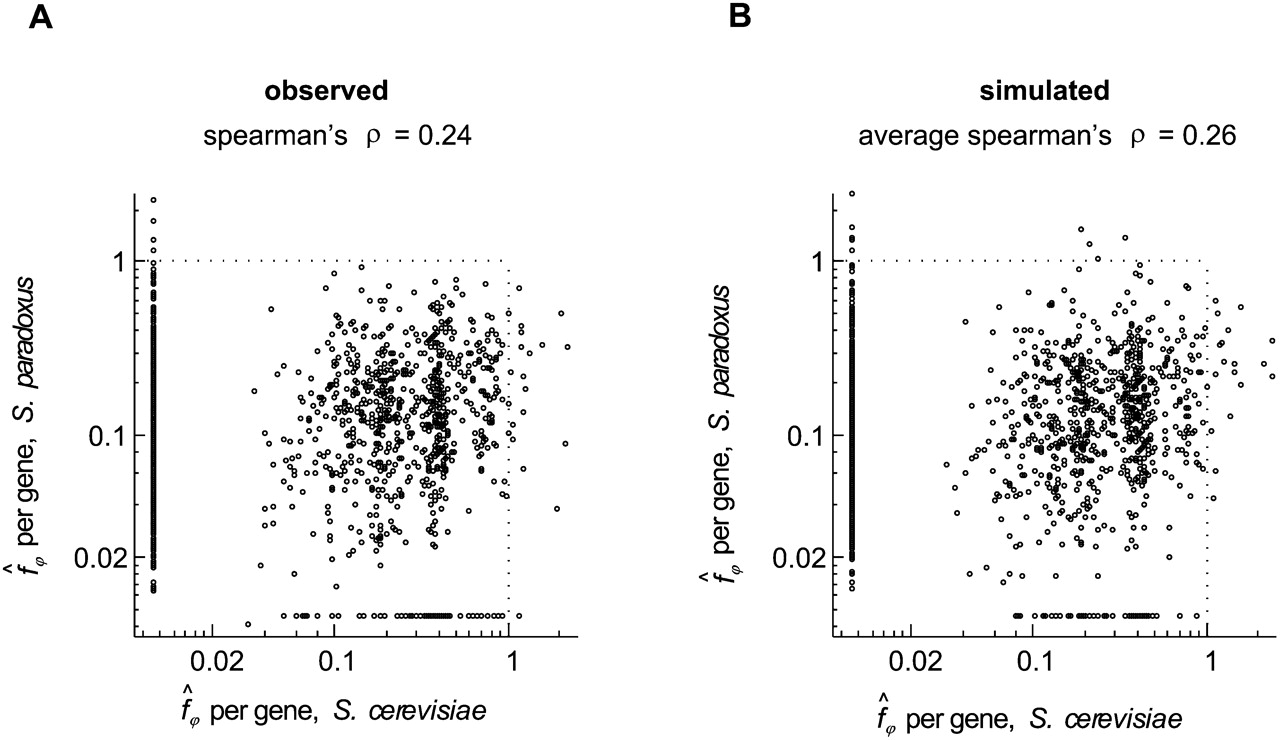
Figure 2.
Correlations between per-gene estimates of fϕ in two populations. (A) The estimates of fϕ for each gene in the European samples of S. cerevisiae and S. paradoxus. The dashed lines mark the range of possible values of the parameters. (B) A similar scatter plot generated by simulation, under a model where f for each gene is identical in the two populations.


