
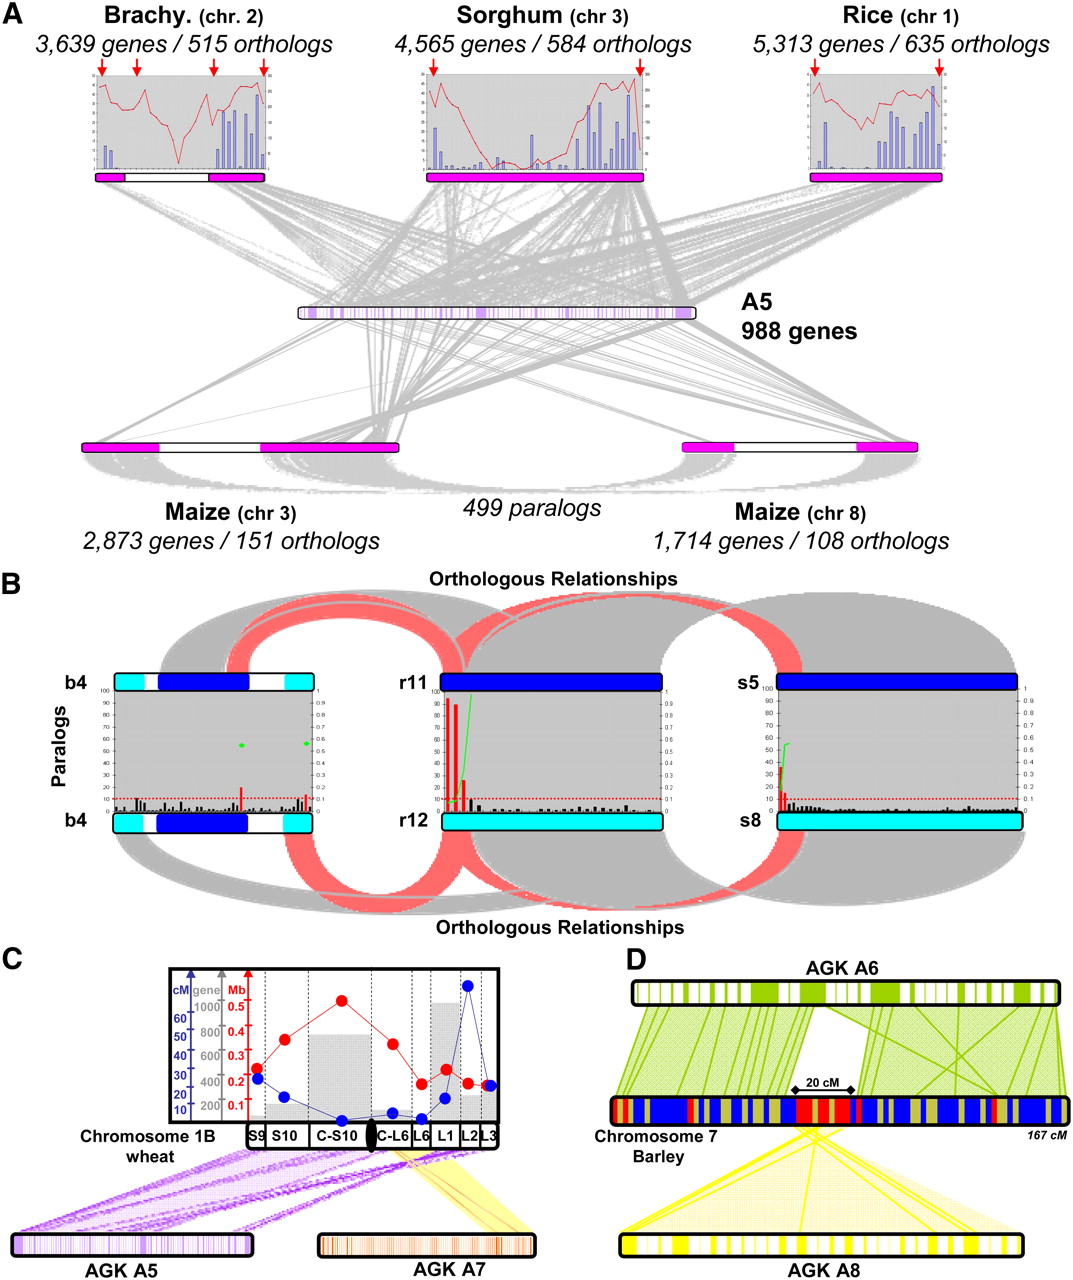
Impact of polyploidization of the genome structure. (A) Illustration of the synteny between Brachypodium chromosome 2 (3639 genes), sorghum chromosome 3 (4565 genes), rice chromosome 1 (5313 genes), maize chromosomes 3–8 (2873 and 1714 genes, respectively), and their ancestral relative (A5, 988 reordered genes in 96 blocks). Orthologous genes are linked with gray lines. Gene distribution (red curves) and percentage of conserved genes (blue bars) per megabase are provided for the Brachypodium, sorghum, and rice chromosomes (top). The duplication identified between maize chromosomes 3 and 8 as part of the recent tetraploidization are linked with gray lines and represent 499 orthologous relationships (bottom). (B) The ancestral duplication A11 and A12 is illustrated in modern grass species, i.e., rice (r11-r12), sorghum (s5-s8), and Brachypodium (b4-b4). The orthologous relationship between b4-r11-s5 (dark blue chromosomes at the top) and b4-r12-s8 (light blue chromosomes at the bottom) is illustrated with gray blocks. Paralogous gene distribution (bars) per megabase is provided for the three pairwise comparisons, i.e., b4-b4, r11-r12, s5-s8. The differential loss of duplicated genes in the subtelomeric region is illustrated with red bars within the gene distribution. The biased gene conversion (BGC) model for the observed differential loss of duplicated gene copies in the subtelomeric region is illustrated with the calculated nucleotide substitution rates (Ks values from 0–1, left scale) shown as green dots for the classes of paralogous couples highlighted with red bars. (C) Illustration of the synteny between wheat chromosome 1B and the ancestral relatives A5 and A7. The orthologous conserved genes are linked with colored lines. The height of wheat chromosome bin (from 1BS9 to 1BL3) is mentioned and is associated with the corresponding physical size (red dots), genetic size (blue dots), and number of conserved genes (gray bars), referring to the corresponding colored y-axis at the left of the figure. (D) Illustration of the synteny between barley chromosome 7 (displayed as chromosome heat map: blue, 5 markers; yellow, <5–10 markers; red, >10 markers in a 2-cM window) and the ancestral relatives A6 and A8. Orthologous conserved genes are linked with green (A6) and yellow (A8) lines. NCFs between A8 and A6 that occurred during the Triticeae genome paleo-history establish that A8 covers a 20-cM centromeric interval in the modern barley chromosome structure.


