
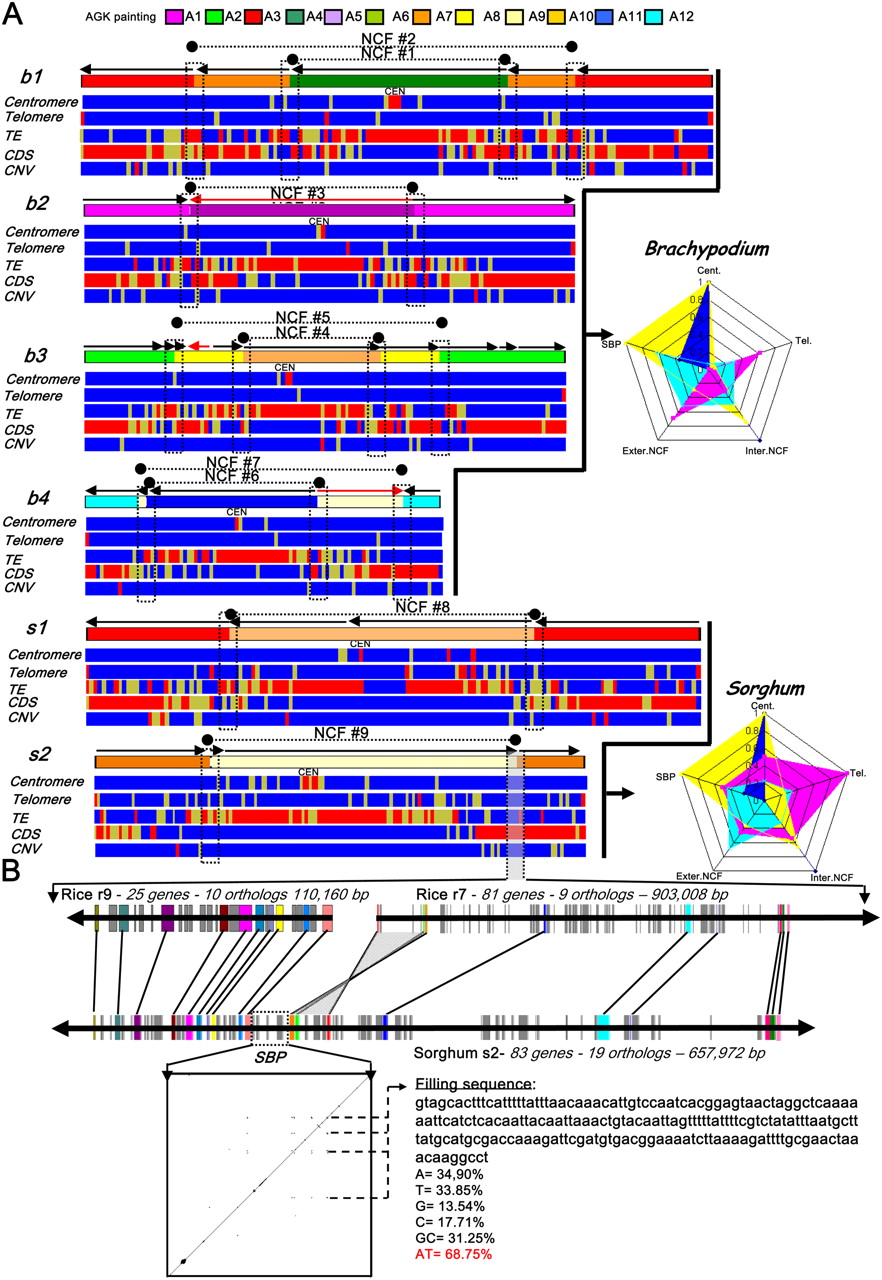
Synteny break points characterization. (A) The four Brachypodium (b1-2-3-4) and two sorghum (s1-2) chromosomes harboring the nine NCFs (black dots linked with dotted lines) identified in these genomes are illustrated according to their ancestral chromosomal origin (i.e., the A1 to A12 color code provided as the AGK painting scale): NCF#1-2 = A6-7-3, NCF#3 = A1-5, NCF#4-5 = A10-8-2, NCF#6-7 = A11-9-12, NCF#8 = A3-10, and NCF#9 = A7-9. For the six chromosomes, a heat map is provided for the telomeric repeat (blue, 0; yellow, <40%; red, >40%), centromeric repeat (blue, 0; yellow, <40%; red, >40%), LTR TE (blue, <80%; yellow, >80%; red, ∼100%), CDS (blue, <40; yellow, 40–50; red, >50), and CNV (blue, <3; yellow, 3–5; red, >5) distribution. The radars for Brachypodium and sorghum genomes represent the percentage (from 0 to 100%) for the centromeric, telomeric, SBPs, and internal and external NCF sequence regions (corresponding to the five radar peaks) harboring centromeric (blue), telomeric (purple), and TE (yellow) repeats as well as CDS (light blue). (B) Detailed representation of the NCF#19. The microsynteny is illustrated for the sorghum chromosome 2 (83 genes, 657 kb) and the rice chromosomes 9 (25 genes, 110 kb) and 7 (81 genes, 903 kb). Conserved genes are indicated with the same color code and linked with black lines. The SBP is indicated with a dotted black box. The dot plot illustrates the alignment of the 51-kb SBP region against itself.


