
Figure 5.
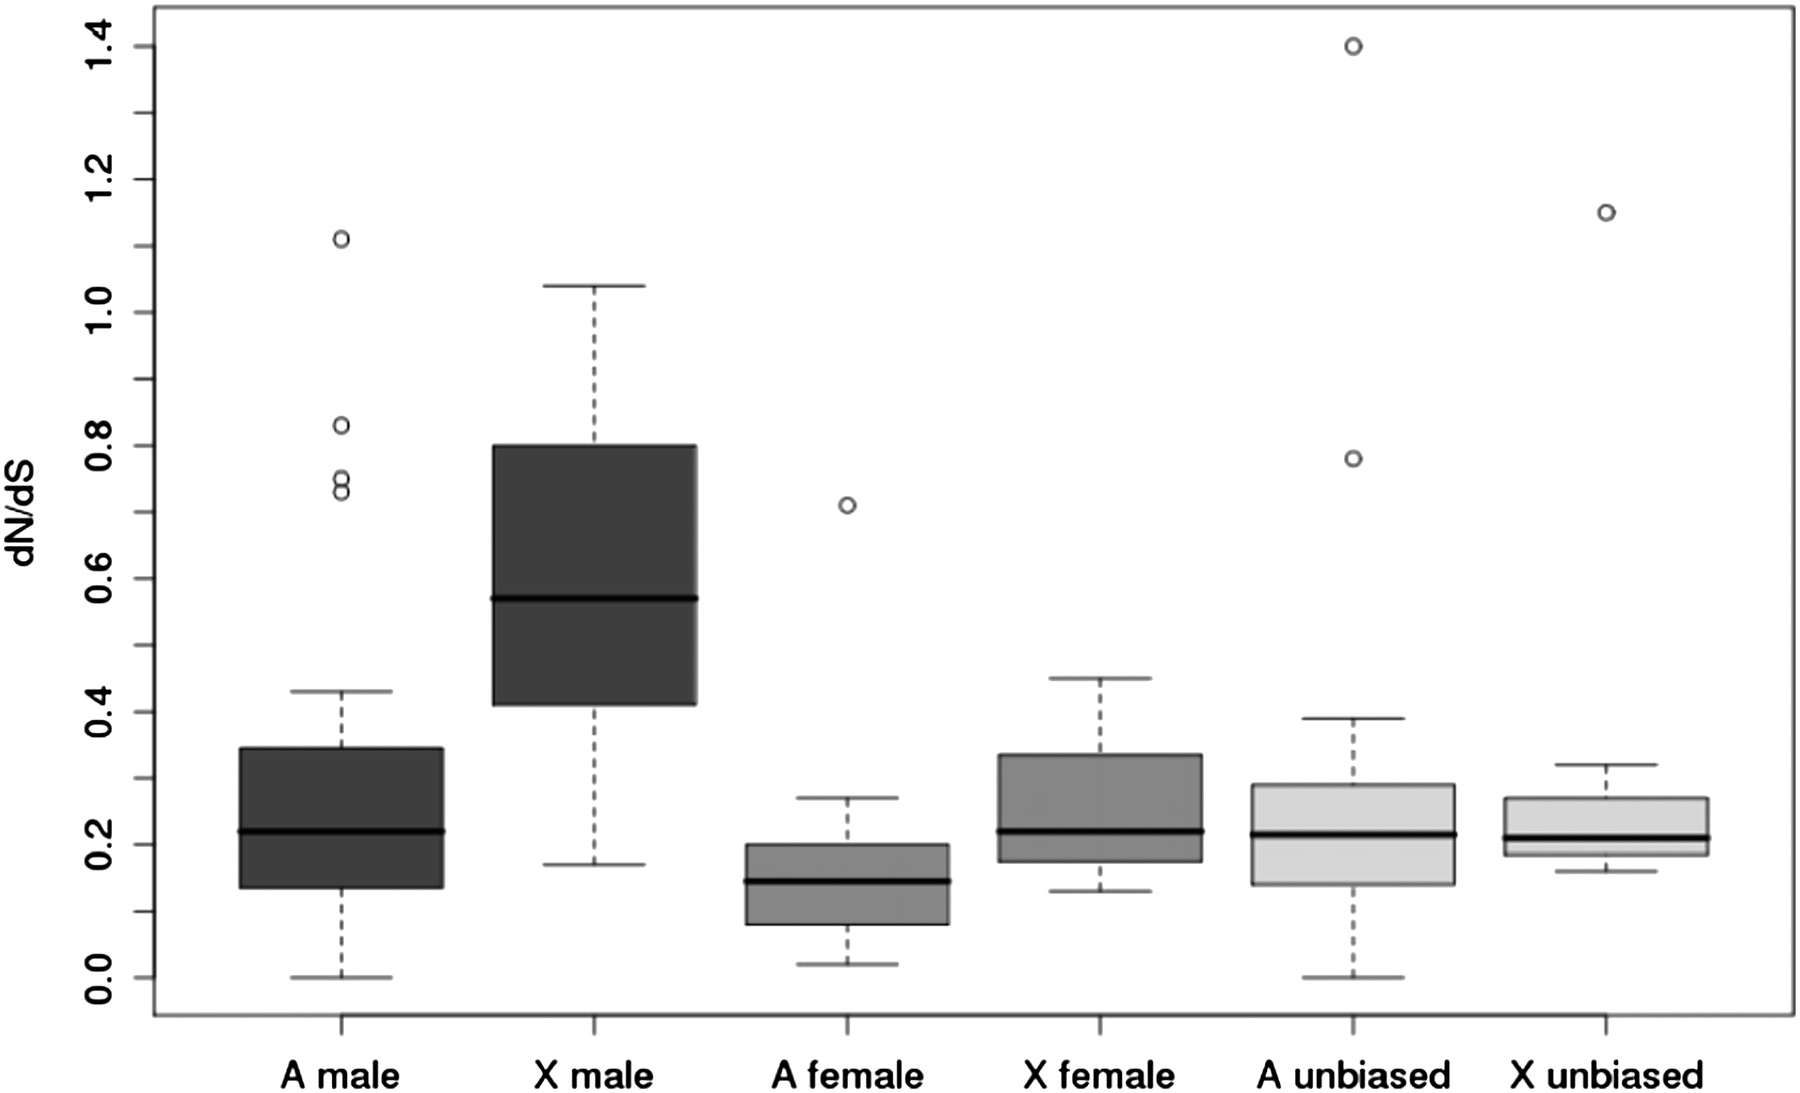
dN/dS distribution across different expression groups. Distinct shades indicate the three groups compared, i.e., male-biased (dark gray), female-biased (medium gray), and unbiased (light gray).
(Downloading may take up to 30 seconds. If the slide opens in your browser, select File -> Save As to save it.)
Click on image to view larger version.
dN/dS distribution across different expression groups. Distinct shades indicate the three groups compared, i.e., male-biased (dark gray), female-biased (medium gray), and unbiased (light gray).
 CiteULike
 Delicious
 Digg
Digg Facebook
 Google+
 Reddit
 Twitter
