
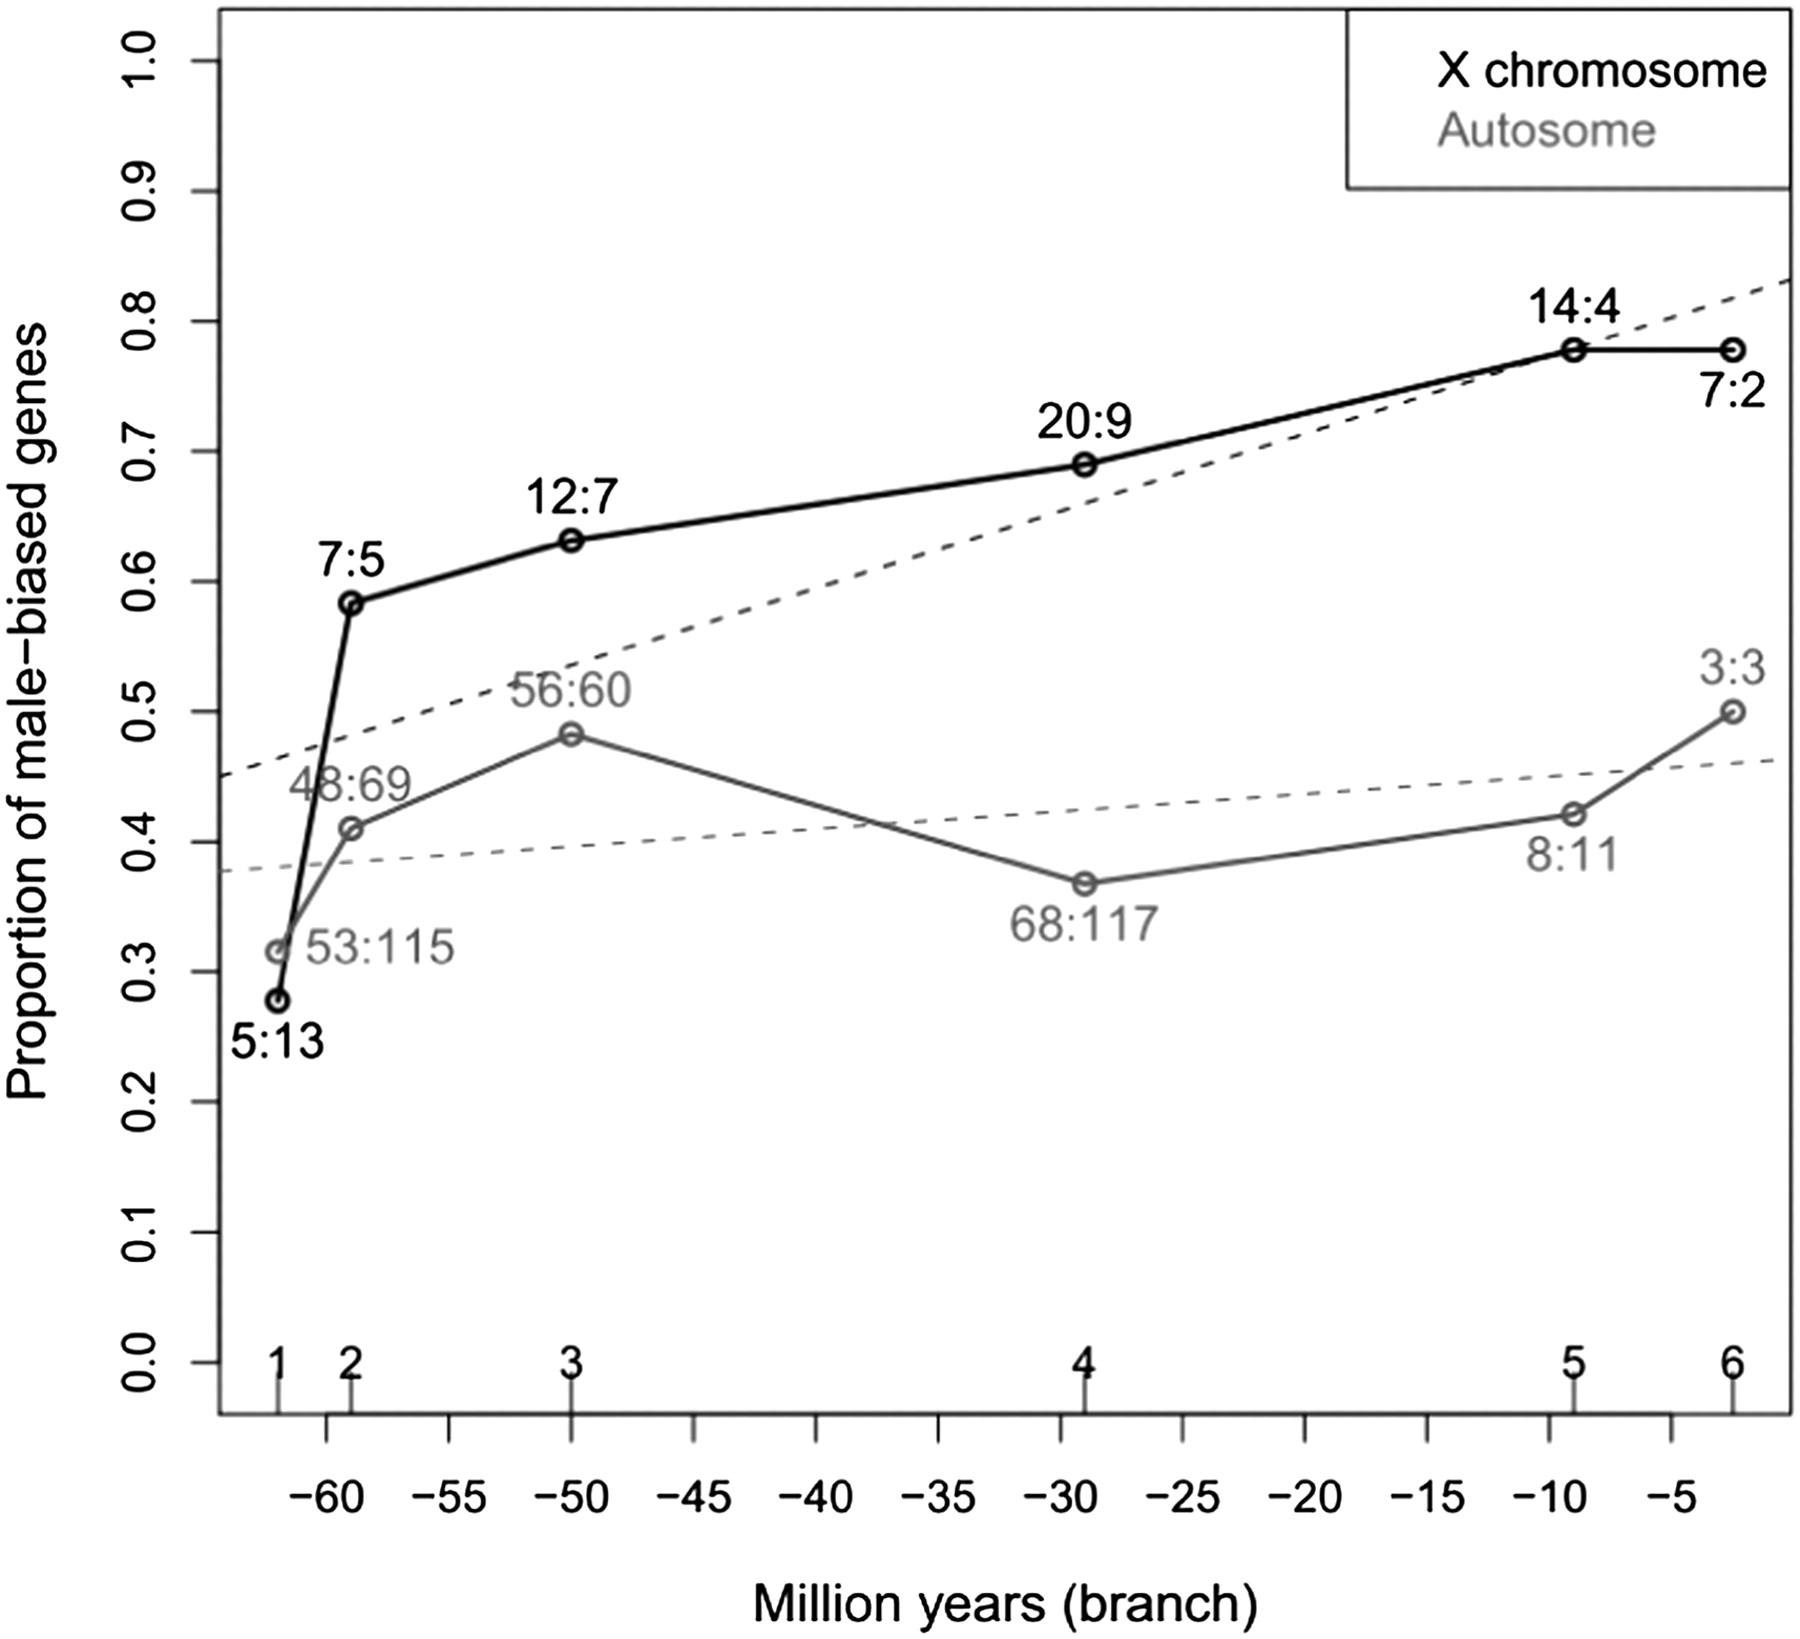
The proportions of male-biased genes in all evolutionary periods. The y-axis presents proportions of male-biased genes for a given chromosome category (X chromosome or autosome), whereas the x-axis indicates evolutionary time scale (branch or Myr). Here, time in millions of years is calculated as the middle point for each branch. For instance, D. melanogaster–specific genes assigned to branch 6 are shown at −2.5 Myr, representing the origination time average for an interval ranging from −5 to 0 Myr. Linear regressions are given as dashed lines. For each data point, numbers of male-biased and non-male-biased genes, respectively, are shown. The data is based on 715 out of the 843 young genes that have unique Affymetrix probes.


