
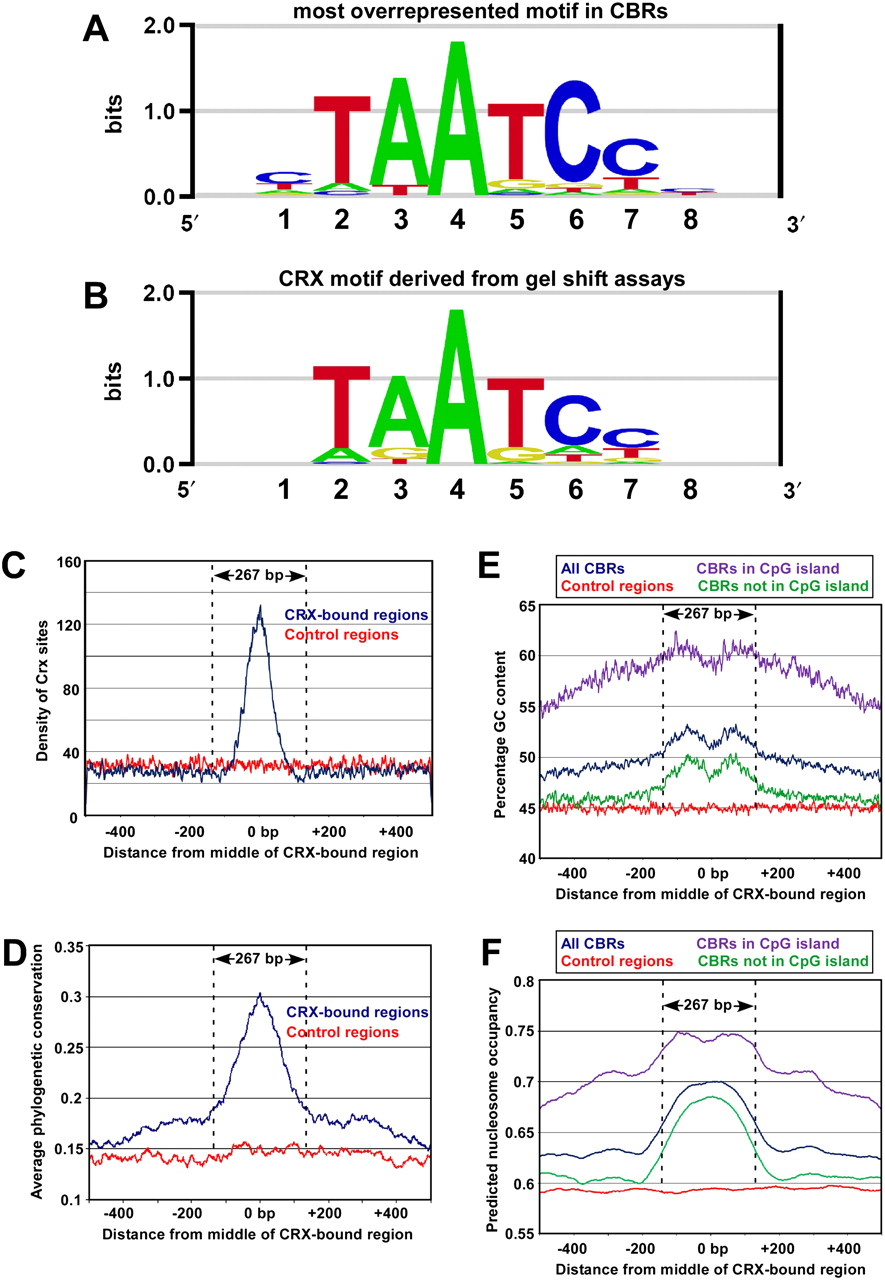
Sequence analysis of CRX-bound regions. (A) Sequence logo representing the single most highly overrepresented motif found in 10,212 CBRs derived from wild-type retina. (B) Sequence logo of the DNA-binding preference of in vitro synthesized CRX protein as determined by quantitative relative affinity gel shift assays (Lee et al. 2010). (C) The distribution of CRX binding sites across a 1-kb region centered on all replicated CBRs (blue curve) and a set of control sequences (red curve). The y-axis indicates the number of CRX sites per nucleotide that have an affinity ≥0.05 of the affinity of a consensus CRX site. The average size of the CBRs (267 bp) is indicated. (D) The average phylogenetic conservation across all replicated CBRs (blue curve) and a set of control sequences (red curve). The y-axis indicates the average phastCons score per nucleotide (Siepel et al. 2005). (E) Percentage GC content across all replicated CBRs (blue curve) and a set of control sequences (red curve). Also shown is the percentage GC content for all replicated CBRs that did (purple curve) or did not (green curve) overlap with CpG islands. (F) Predicted nucleosome occupancy based on a prior study (Kaplan et al. 2009), across all replicated CBRs (blue curve) and a set of control sequences (red curve). Also shown is the predicted nucleosome occupancy for all replicated CBRs that did (purple curve) or did not (green curve) overlap with CpG islands.


