
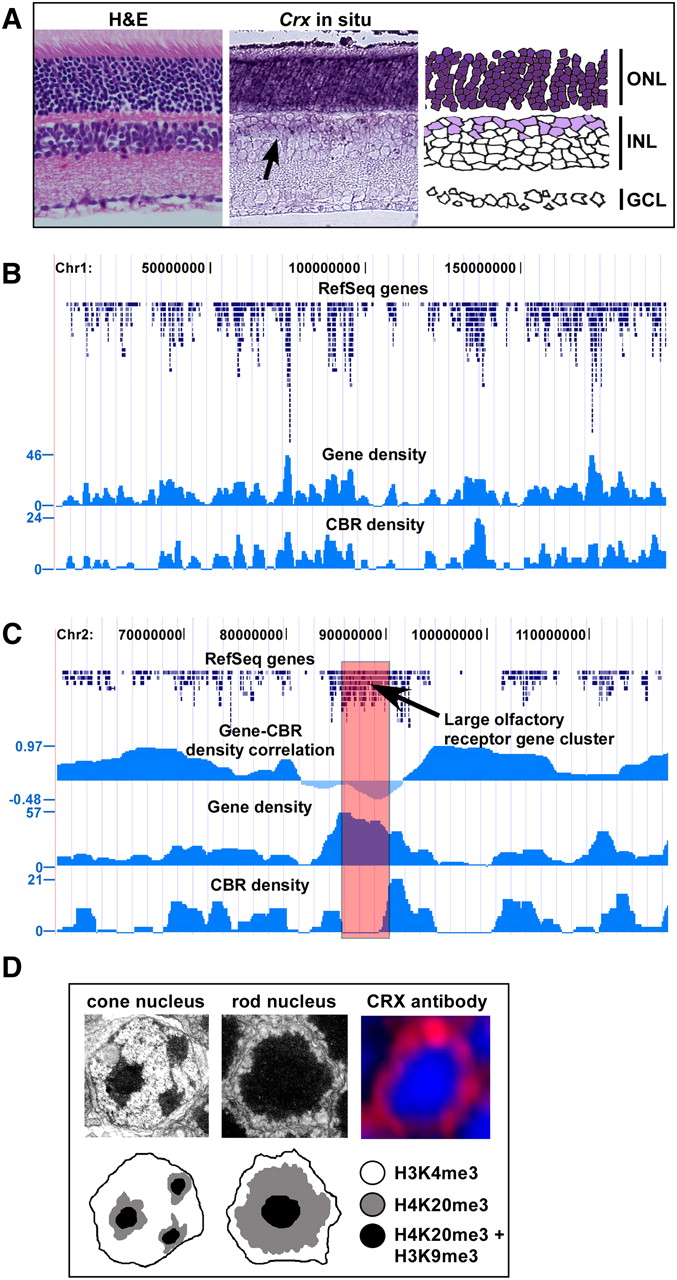
Genomic distribution of CRX-bound regions in rod photoreceptors. (A) Hematoxylin and eosin (H&E)–stained section of adult retina and in situ hybridization on adult retina using a probe against Crx. There is strong, uniform staining for Crx throughout the outer nuclear layer (ONL; dark purple) which is composed of the cell bodies of both rod and cone photoreceptors. In addition, there is fainter staining in a subset of cells in the inner nuclear layer (INL) that represent bipolar cells. GCL, Ganglion cell layer. (B) Graph of gene density and CBR density across mouse chromosome 1, showing a strong correlation between the two. (C) Graph of gene density, CBR density, and the correlation between the two for a portion of mouse chromosome 2. In the central portion of the graph, there is a region of poor correlation between gene density and CBR density, which represents a large cluster of olfactory receptor genes. (D) Electron micrographs of a cone and rod nucleus along with antibody staining for CRX in a rod nucleus. In the antibody staining, the nuclei are counterstained with DAPI which highlights the heterochromatin. The bottom tier of the figure depicts schematics of the cone and rod nuclei, indicating the expected pattern of a marker for gene-rich euchromatin (H3K4me3) and two markers for gene-poor heterochromatin (H4K20me3 and H3K9me3). These patterns of chromatin markers are based on a prior study (Solovei et al. 2009).


