
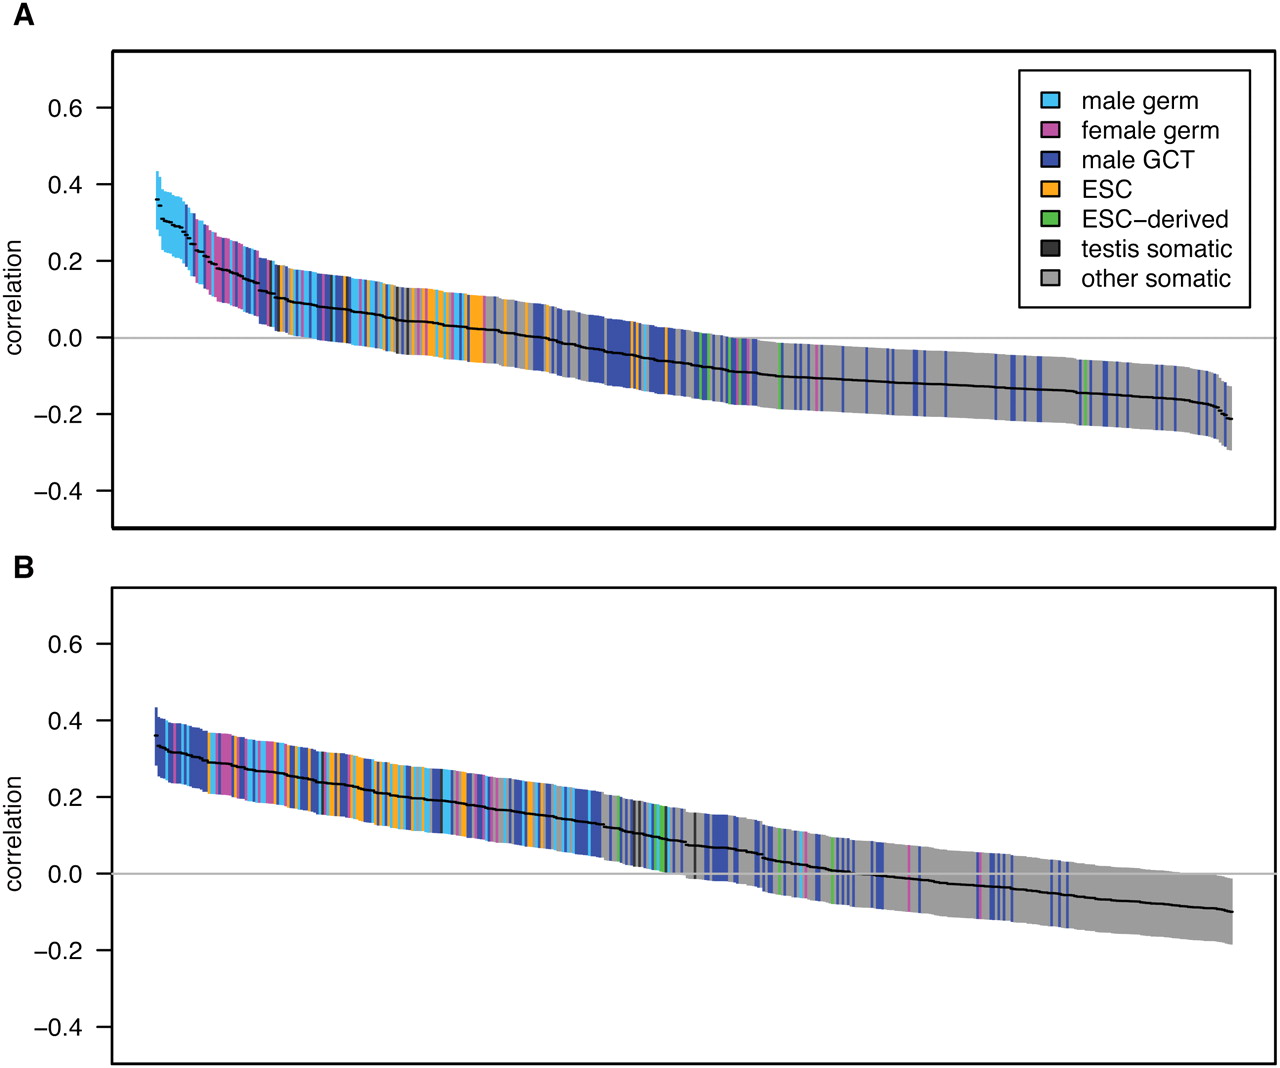
Figure 5.
Pairwise correlations between gene expression and transposable element density for high tissue differentiation genes. The figure layout is as described in Figure 1. Correlations are between gene expression and L1 density (A) or Alu density (B) (n = 507). For correlations with the complete gene set, see Supplemental Figure S3.


