
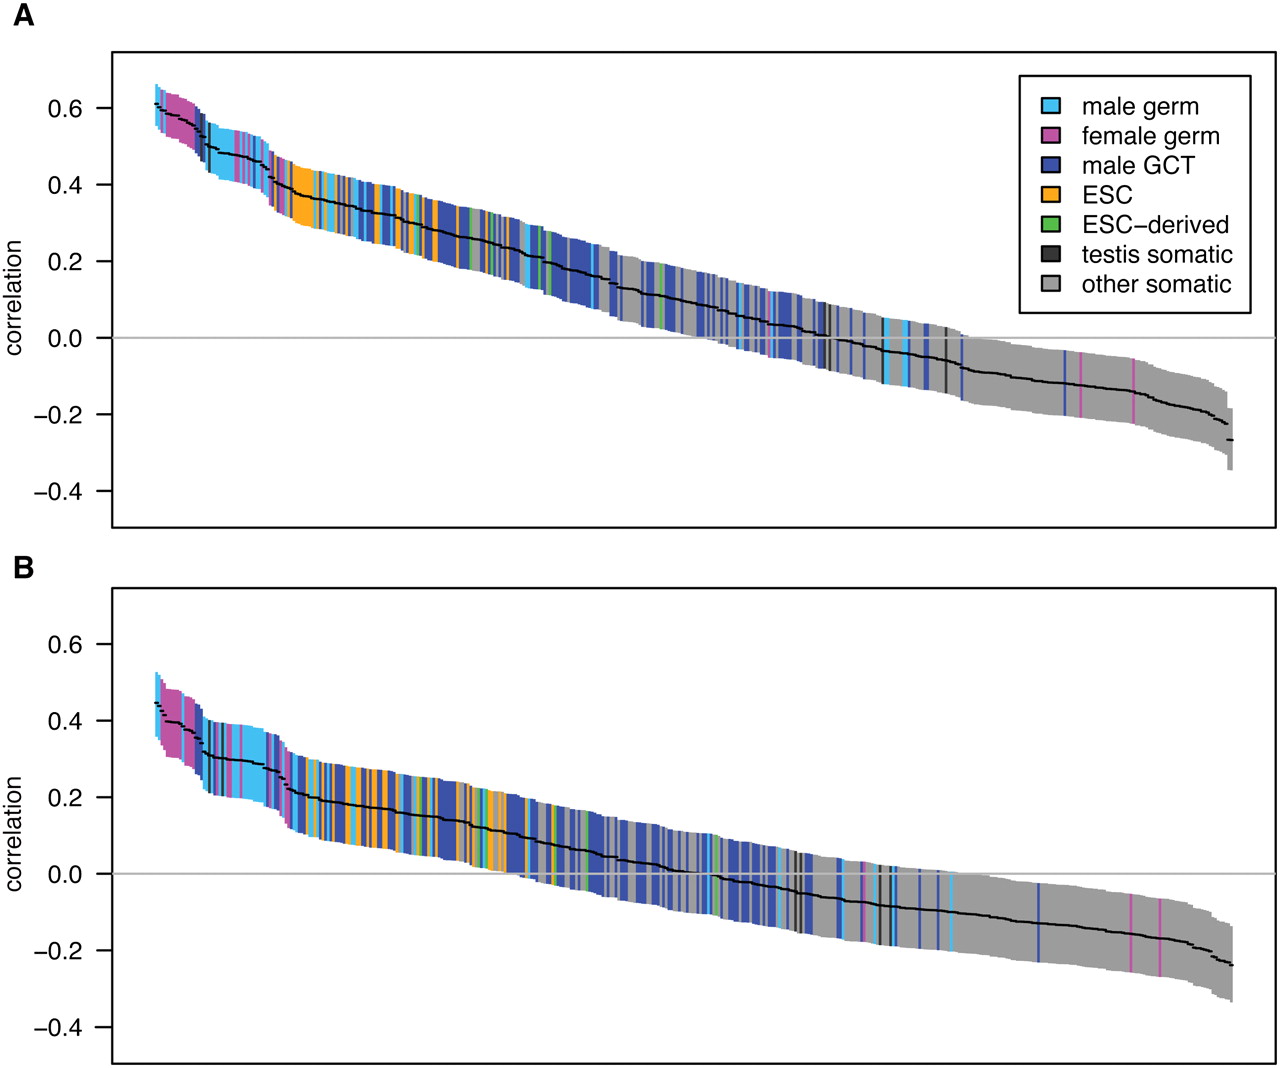
Figure 4.
Pairwise correlations between gene expression and strand-biased composition and substitution rates for high tissue differentiation genes. The figure layout is as described in Figure 1. Correlations are between gene expression and G+T content (n = 507) (A) or A → G/T → C substitution asymmetry (n = 346) (B). For correlations with the complete gene set, see Supplemental Figure S2.


