
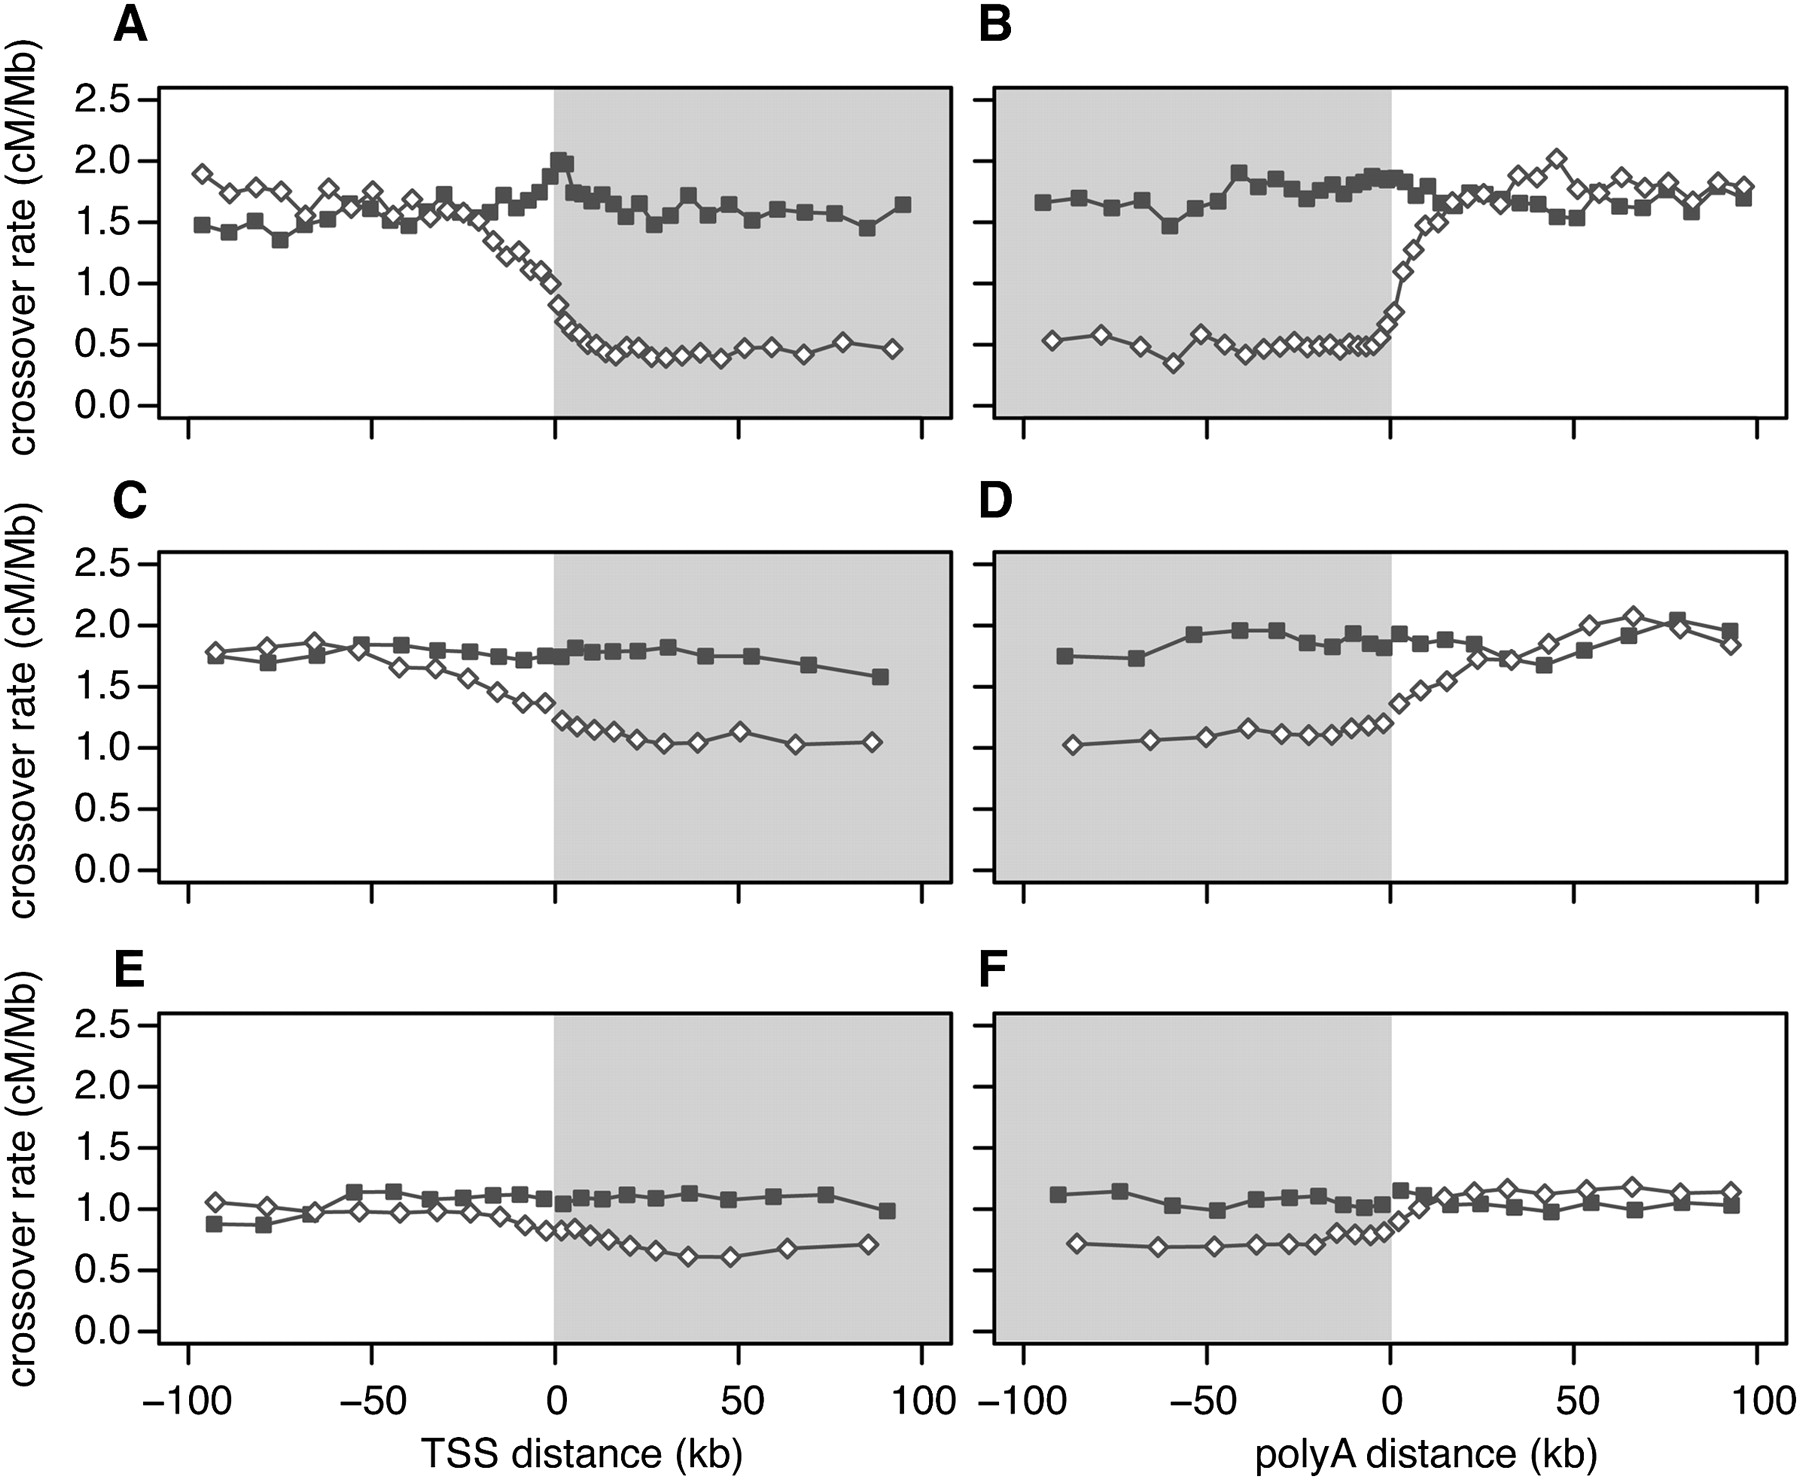
Crossover rate as a function of distance from the nearest transcription start site (TSS), and the nearest polyadenylation site. To calculate distances, we used the 5′-most TSS and the 3′-most poly(A) site in genes having more than one such site. Gray shading denotes transcribed regions. (A,B) Linkage disequilibrium–based crossover rates for genes with high (open diamonds) and low (filled squares) meiotic gene expression. (C,D) Pedigree-based female crossover rates for genes with high (open diamonds) and low (filled squares) fetal ovary expression from 12 –18 wk gestation. (E,F) Pedigree-based male crossover rates for genes with high (open diamonds) and low (filled squares) spermatocyte expression.


