
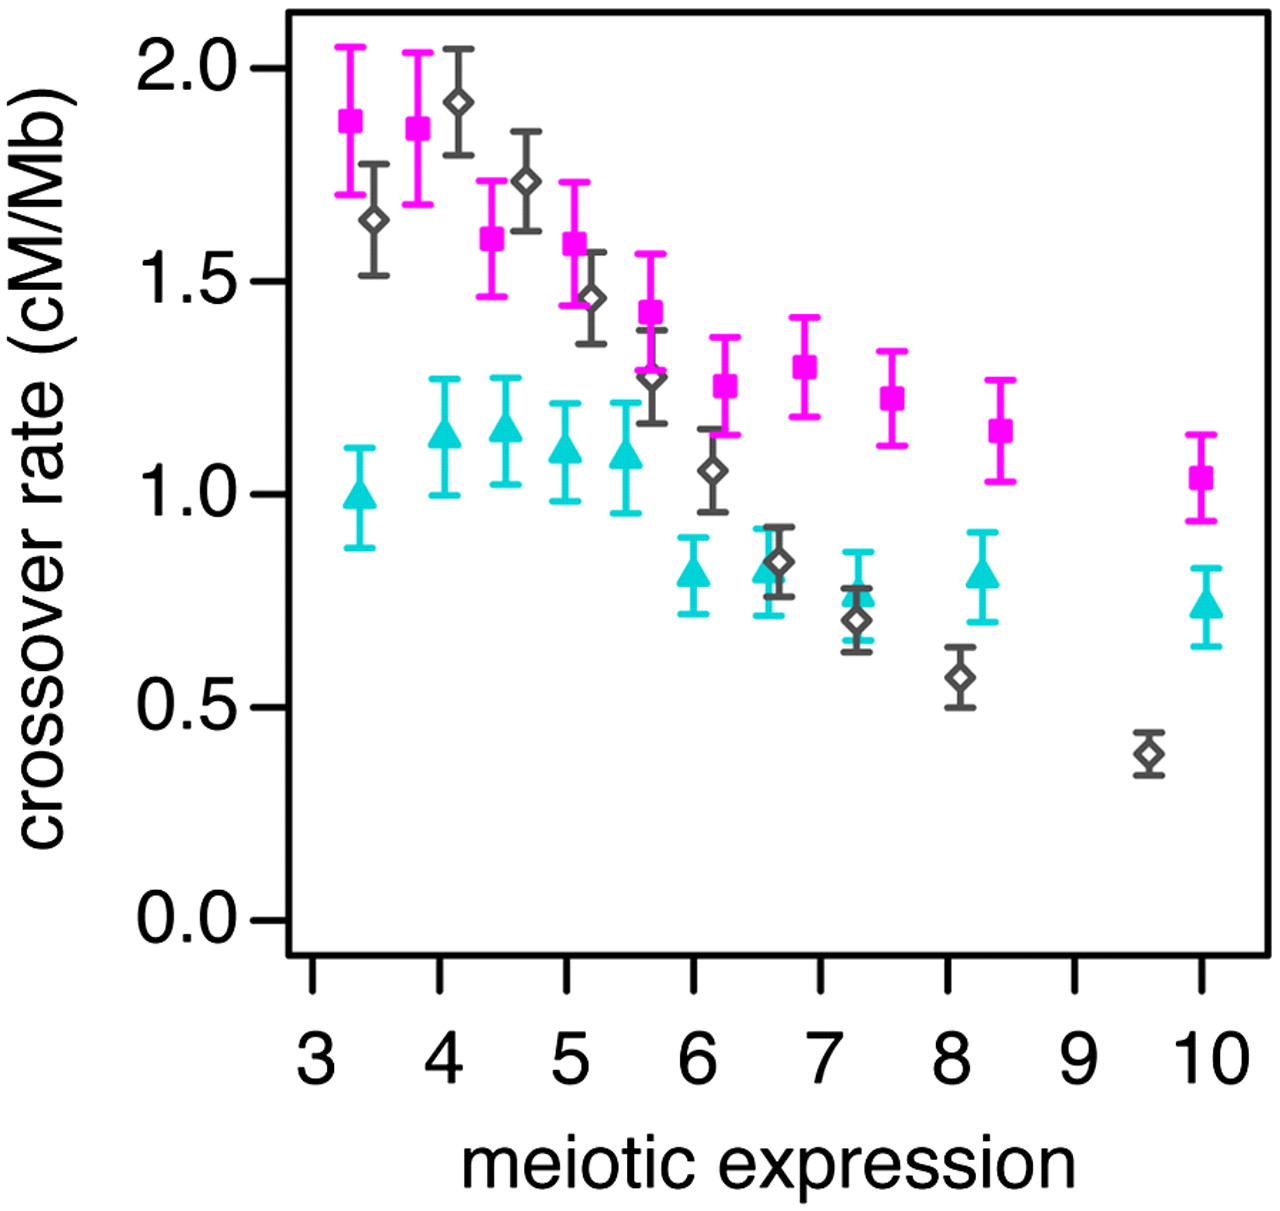
Crossover rate as a function of gene expression. Crossover rates for each gene are estimated from male (blue triangles) and female (pink squares) pedigree-based linkage maps or a fine-scale linkage-disequilibrium map (open diamonds). Genes are binned by their meiotic expression (into 10 bins of 1239 genes each); each point gives the mean crossover rate of the genes in a bin. Meiotic expression estimates are from fetal ovaries from 12–18 wk gestation (female map), spermatocytes (male map), or an average of the two (LD-based map). Only autosomal genes of at least 10 kb in length were used in this analysis. Error bars are 95% confidence intervals.


