
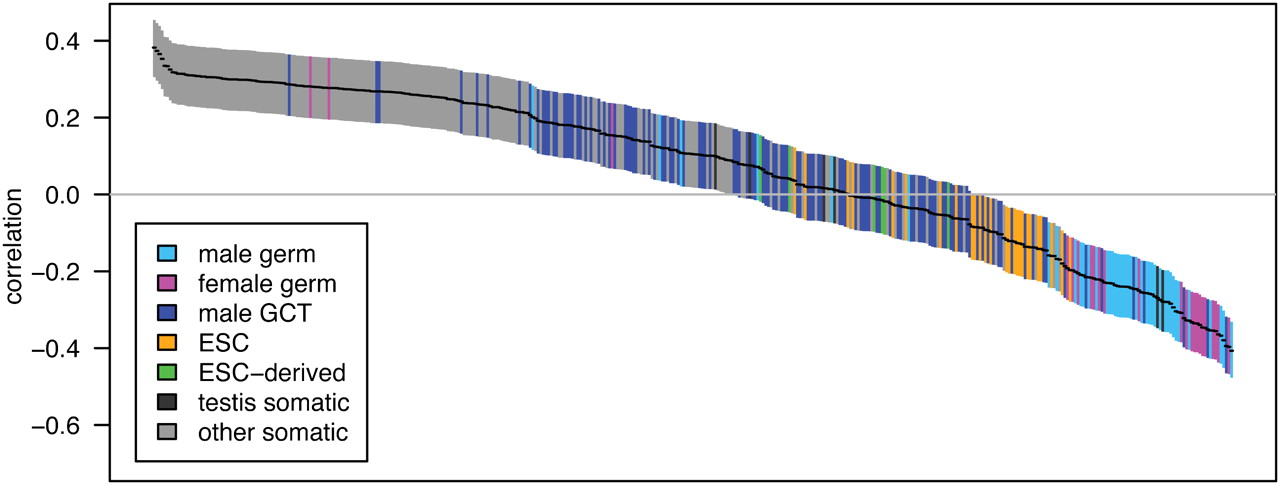
Pairwise correlations between gene expression and crossover rate for a set of genes with high tissue differentiation. Each of the 409 tissue samples is represented by a single bar, colored by tissue type as defined in the key (ESC, embryonic stem cells; GCT, germ cell tumors). Bars are ordered from left to right by the correlation coefficient, r, with the vertical extent of the bar indicating the 95% confidence interval. Only the 507 genes with at least 10 kb of sequence data and the highest tissue differentiation were included in this analysis, as these genes have more tissue-specific patterns of expression and provide the most power for discriminating between tissues; for correlations with the complete gene set see Supplemental Figure S1.


