
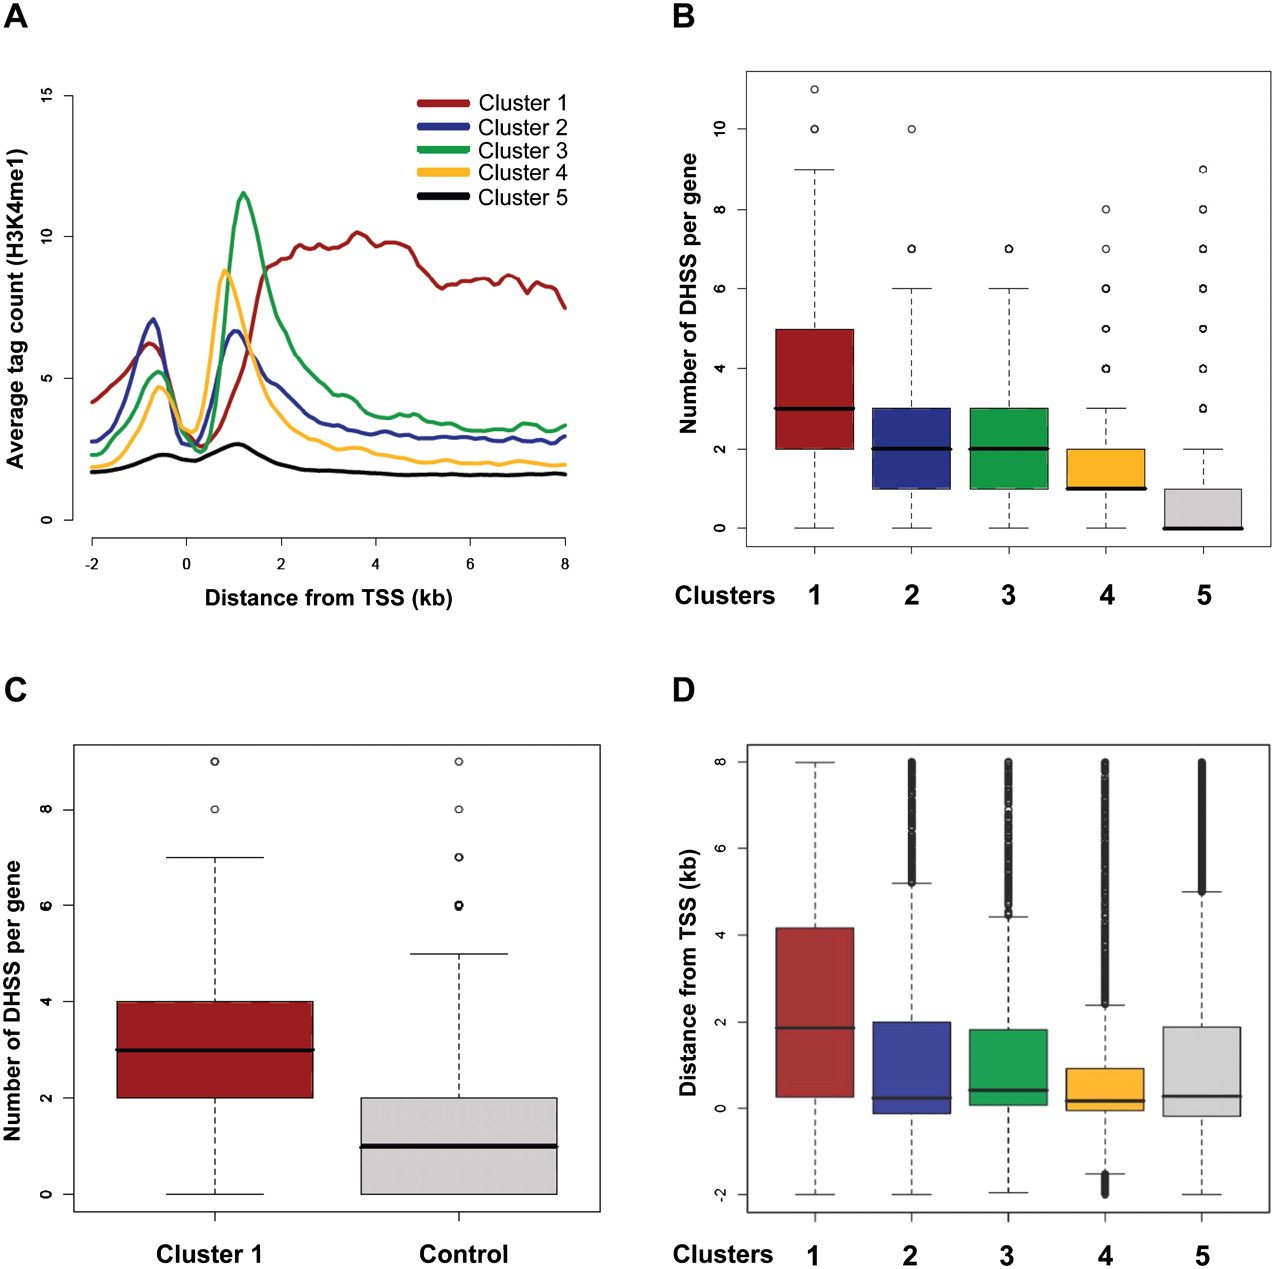
Figure 5.
Epigenetic and accessibility profiles reflect different modes of transcriptional control of genes within the H3K4me2 clusters. (A) H3K4me1 average profiles. (B) The number of DHSS in regions from TSS to 8 kb downstream is shown. (C) Comparison between the frequency of DHSS in genes within cluster 1 and that observed for all genes expressed at the same level. (D) Distribution of DHSS locations with respect to the TSS for each H3K4me2 cluster.


