
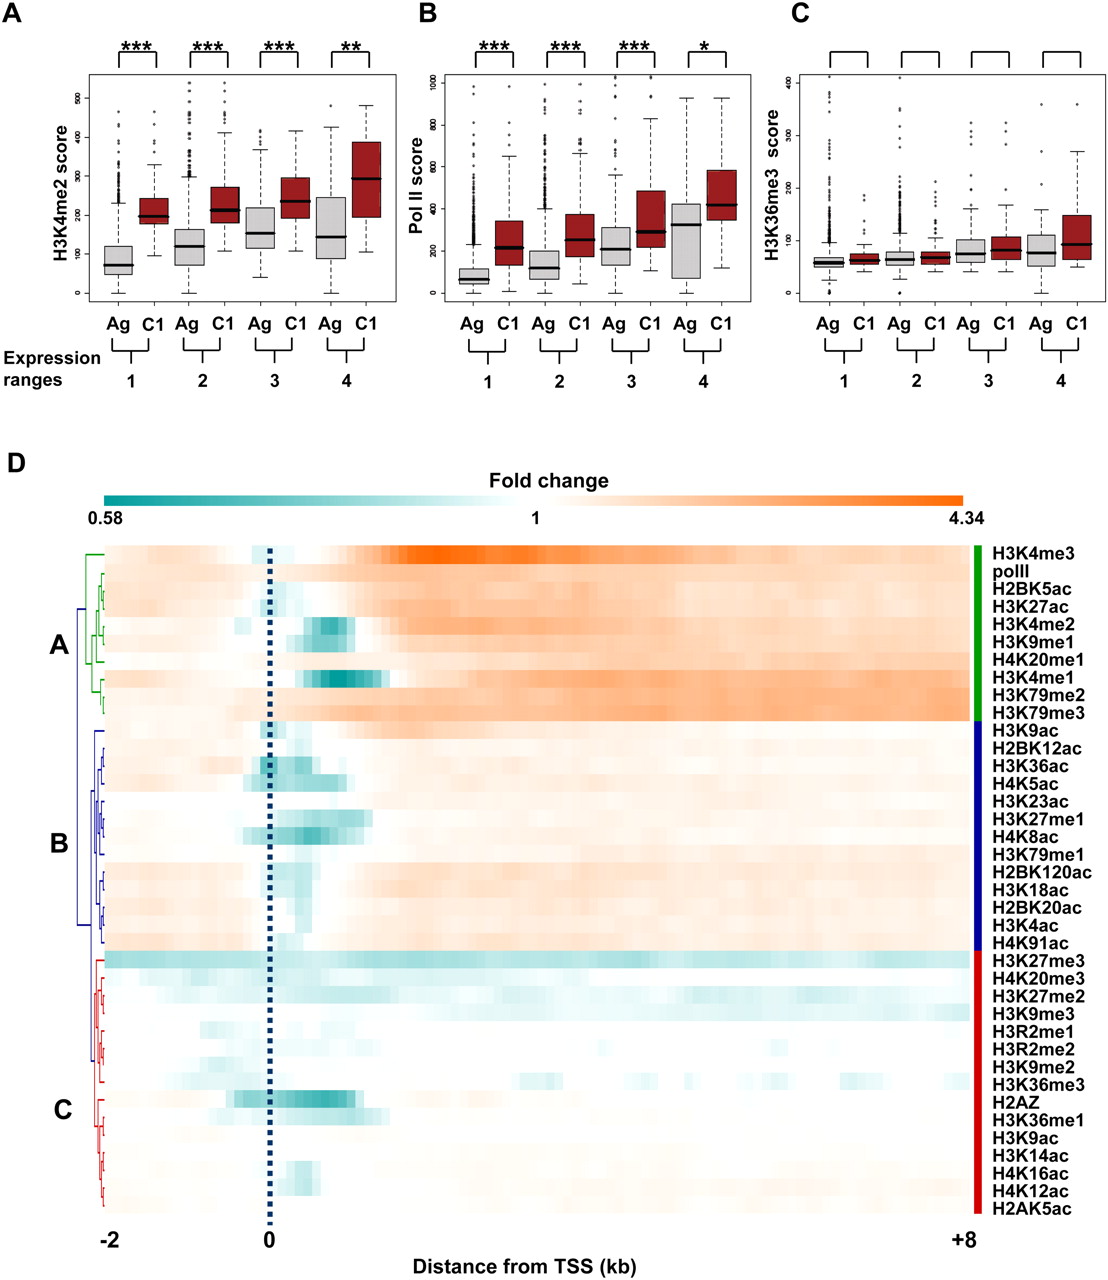
Genes within cluster 1 show increased levels of specific epigenetic modifications. Comparison of scores of H3K4me2 (A), RNA polymerase II (B), and H3K36me3 (C) for all nonoverlapping genes (Ag, gray box plots) or genes found within cluster 1 (C1, red box plots) in the analyzed genic regions (0–8 kb) was performed for four distinct ranges of gene expression (see text). A significant difference between values obtained for genes within cluster 1 versus the control genes was observed for each range of gene expression (*P < 0.05, **P < 0.005, ***P < 0.0005, Mann-Whitney U test). (D) Direct comparison of epigenetic marks and Pol II between genes within cluster 1 and a control set of genes. A normalized signal in the regions −2 to +8 kb around the TSS was calculated in each case by dividing the average signal obtained for cluster 1 by the average signal obtained for all genes expressed at the same level as genes within cluster 1. A hierarchical clustering of these values is shown. Most of the analyzed modifications displayed a marked decrease in signal levels in the regions close to the TSS.


