
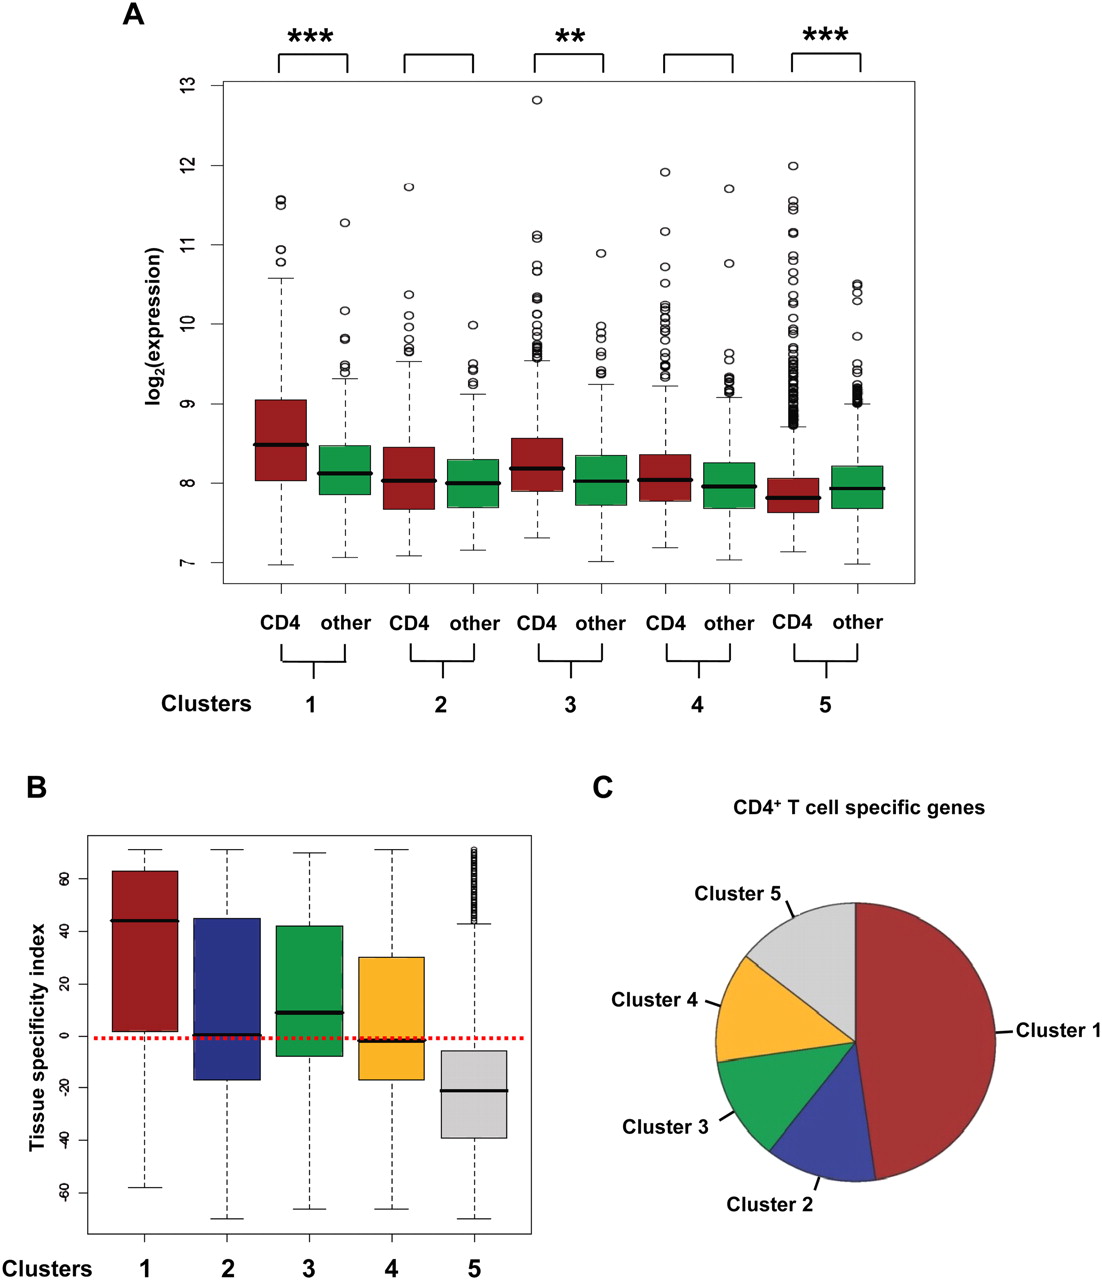
Genes within cluster 1 are preferentially expressed in CD4+ T cells. (A) Box plots showing the comparison between levels of gene expression from different H3K4me2 clusters in CD4+ T cells and the mean level of expression calculated across all other tissues (except CD4+ T cells; **P < 0.005, ***P < 0.0005, Mann-Whitney U test; other, other tissues). (B) Box plots showing per gene calculations of the net number of tissues per gene (i.e., T cell specificity index), for which a difference of expression (between a given tissue and CD4+ T cells) was statistically significant (Benjamini-Hochberg adjusted P < 0.05, moderated t-test). (C) Pie plot showing the distribution of CD4+ T-cell-specific genes within the five H3K4me2 clusters.


