
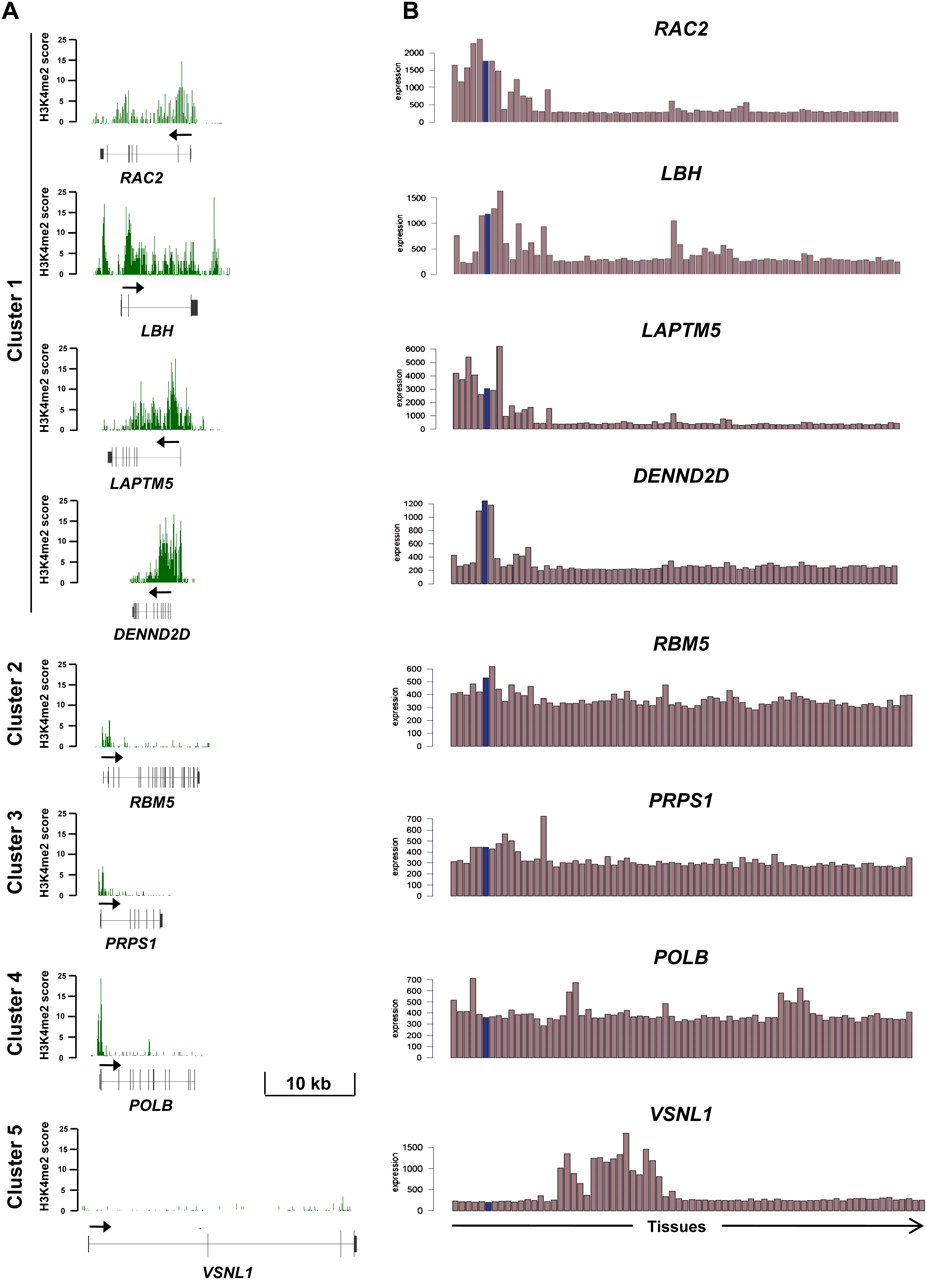
H3K4me2 enrichment profiles at genes within the five H3K4me2 clusters. (A) Examples of H3K4me2 enrichment profiles are shown. Gene structure (all genes drawn at the same genomic scale) and transcriptional orientation (arrow) are indicated at the bottom of each panel. (B) Tissue expression of genes shown in A. The following tissues were analyzed (from left to right): whole blood, CD33 myeloid, CD4 monocytes, dendritic cells, CD56 NK cells, CD4 T cells, CD8 T cells, B cells, endothelial cells, CD34 HSC, thymus, tonsil, lymph node, fetal liver, early erythroid, bone marrow, temporal lobe, globus pallidus, cerebellum peduncles, cerebellum, caudate nucleus, whole brain, parietal lobe, medulla oblongata, amygdala, prefrontal cortex, occipital lobe, hypothalamus, brain thalamus, subthalamic nucleus, cingulate cortex, pons, spinal cord, fetal brain, adrenal gland, lung, heart, liver, kidney, prostate, uterus, thyroid, fetal thyroid, fetal lung, placenta, cardiac myocytes, smooth muscle, HBEC, cultured adypocyte, pancreas, islet cells, testis, testis leydig cell, testis germ cell, testis interstitial cells, testis seminiferous tubulae, salivary gland, trachea, adrenal cortex, ovary, appendix, skin, ciliary ganglion, trigeminal ganglion, atrioventricular node, DRG, superior cervical ganglion, skeletal muscle, uterus corpus, tongue, olfactory bulb, and pituitary. Expression levels in CD4+ T cells are highlighted in blue.


