
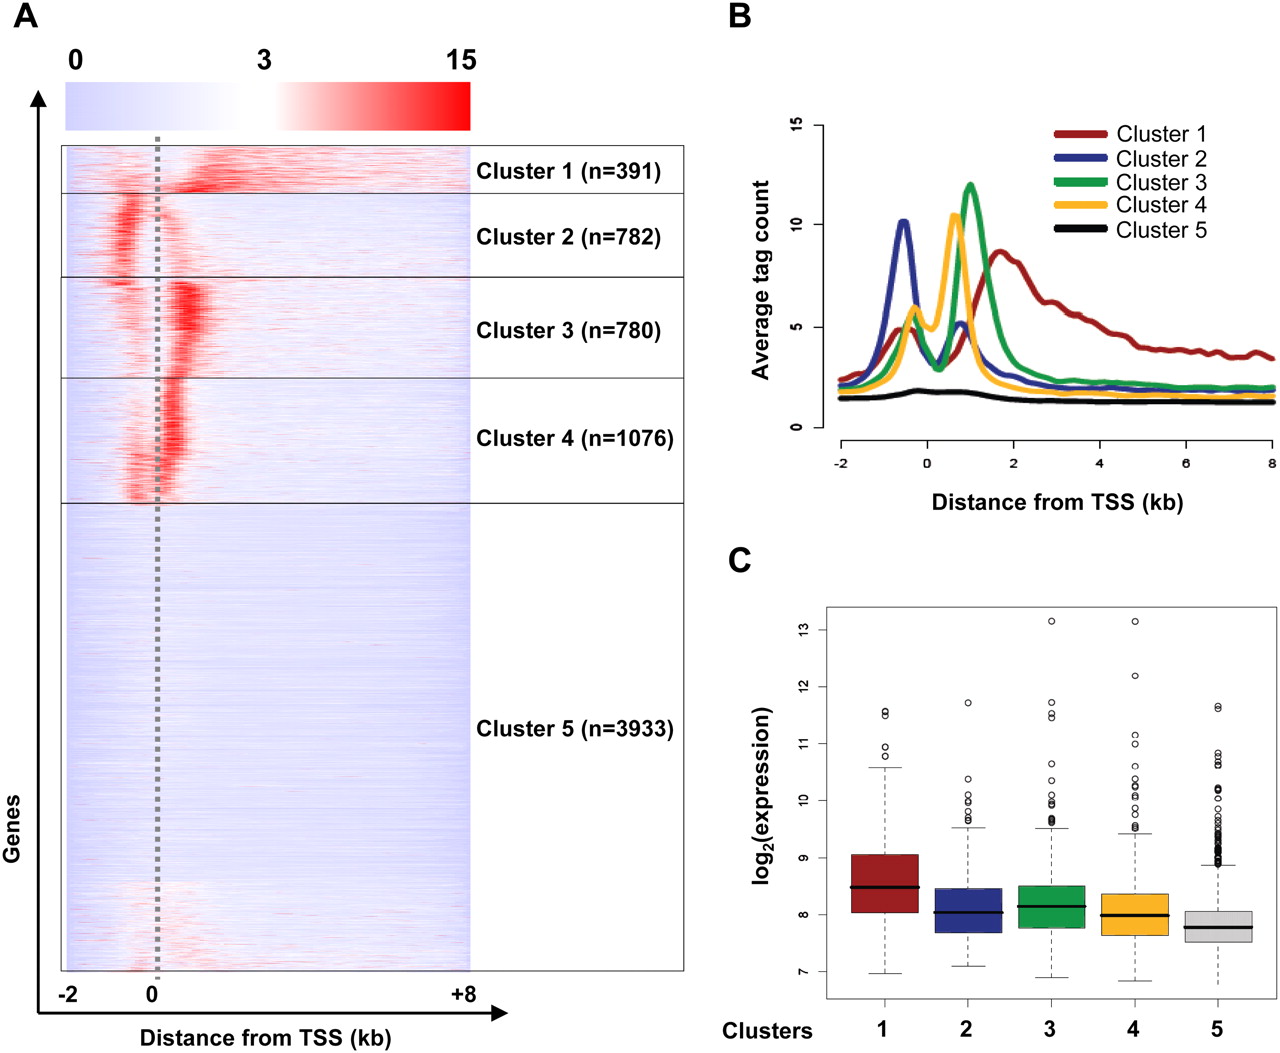
Figure 1.
Clustering of H3K4me2 profiles reveals the presence of five main clusters. (A) K-means clustering of H3K4me2 profiles in regions from −2 to +8 kb around the TSS of a set of nonoverlapping genes. The Euclidean distance was used as a measure of similarity. Color scale indicates the level of enrichment. The number of genes within each cluster is indicated at the right of the panel (a list of all genes per cluster is provided in Supplemental Table 1). (B) Average profiles of H3K4me2 for genes within the five identified clusters. (C) Box plots showing the level of expression in CD4+ T cells of genes identified in the different H3K4me2 clusters.


