
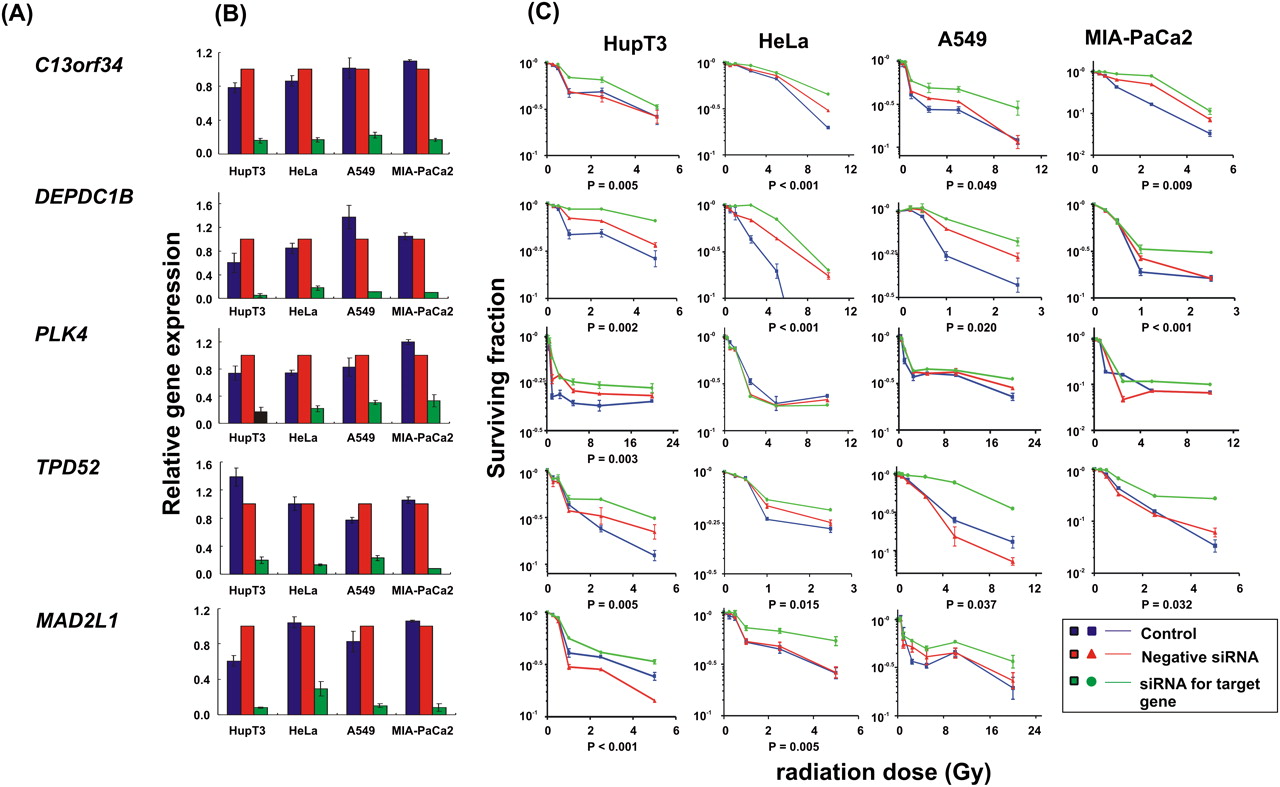
siRNA screening of candidate genes by colony-forming assay performed with multiple cancer cell lines. Data for five of the 23 top candidate genes were selected for colony-forming assays using HupT3, MIA-PaCa2, HeLa, and A549 cancer cell lines. qRT-PCR was also performed to determine knockdown efficiency. At least three independent experiments were performed in triplicate. Error bar, SEM of at least three independent experiments. Significance was defined by P-values. (A) Candidate gene symbols. (B) qRT-PCR to assess expression levels for each candidate gene after knockdown in each cell line. (C) Colony-forming assays performed with HupT3, MIA-PaCa2, HeLa, and A549 cancer cell lines. The x-axis indicates the radiation dose, and the y-axis indicates the surviving fraction after radiation exposure.


