
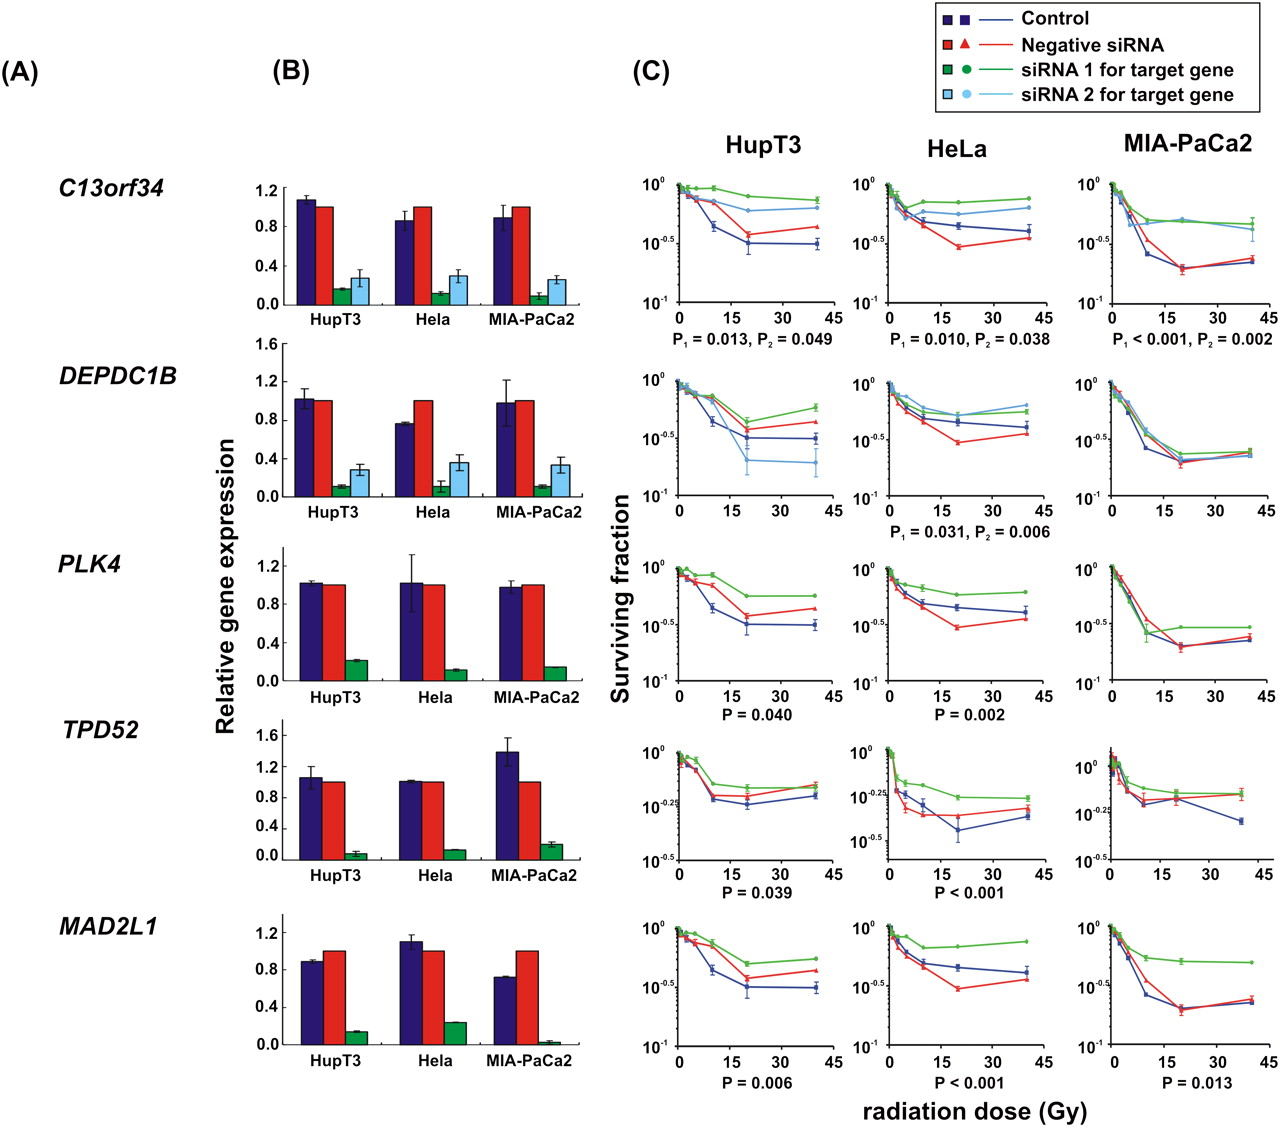
siRNA screening of candidate genes by MTS assay in multiple cancer cell lines. Data are shown for five of the top 23 candidate genes that were studied functionally in HupT3, MIA-PaCa2, and HeLa cancer cell lines by MTS assay after siRNA knockdown performed with two “unvalidated” or one “validated” siRNA when available. (Blue) Data for nontransfected cells; (red) negative control siRNA; (green, light blue) data for specific siRNAs. “Significance” was defined as a gene with a significant change in apparent AUC in comparison with control siRNA and was indicated by the P-value. If two siRNAs were available, “significance” was defined as a gene with significant changes for both siRNAs, and P1 and P2 represented the P-values for siRNA 1 and siRNA 2, respectively. At least three independent experiments were performed in triplicate. Error bar, SEM of at least three independent experiments. (A) Candidate gene symbols. (B) qRT-PCR. The y-axis indicates relative gene expression after siRNA knockdown when compared with “all star negative” siRNA. (C) MTS assays. The x-axis indicates the radiation dose, and the y-axis indicates the surviving fraction after exposure to radiation.


