
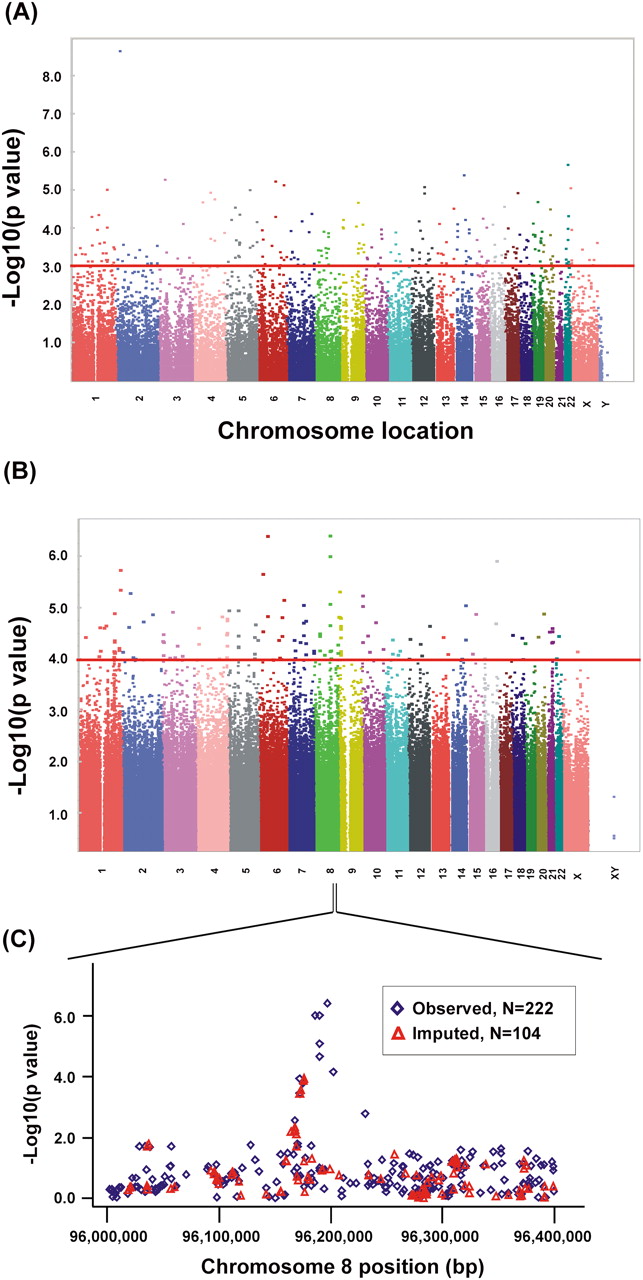
Genome-wide associations with radiation AUC. (A) Association of basal expression with radiation AUC for 277 cell lines. The y-axis represents the –log10(P-value) for the association of individual expression array probe sets. Expression probe sets are plotted on the x-axis based on the chromosomal locations of their genes. If genes had more than one probe set, the one with the lowest P-value was plotted. A P-value of 10−3 is highlighted with a red line. (B) Genome-wide SNP association with radiation AUC for 277 cell lines. The y-axis represents −log10(P-value) for the association of each SNP with radiation AUC. SNPs are plotted on the x-axis based on their chromosomal locations. A P-value of 10−4 is highlighted with a red line. (C) This panel shows the most significant locus on chromosome 8 that was associated with radiation AUC. Blue diamonds indicate SNPs observed by genotyping, while red triangles indicate imputed SNPs. The y-axis represents –log10(P-value) for the association of each SNP with radiation AUC, and the x-axis represents the location of the SNP on chromosome 8.


