
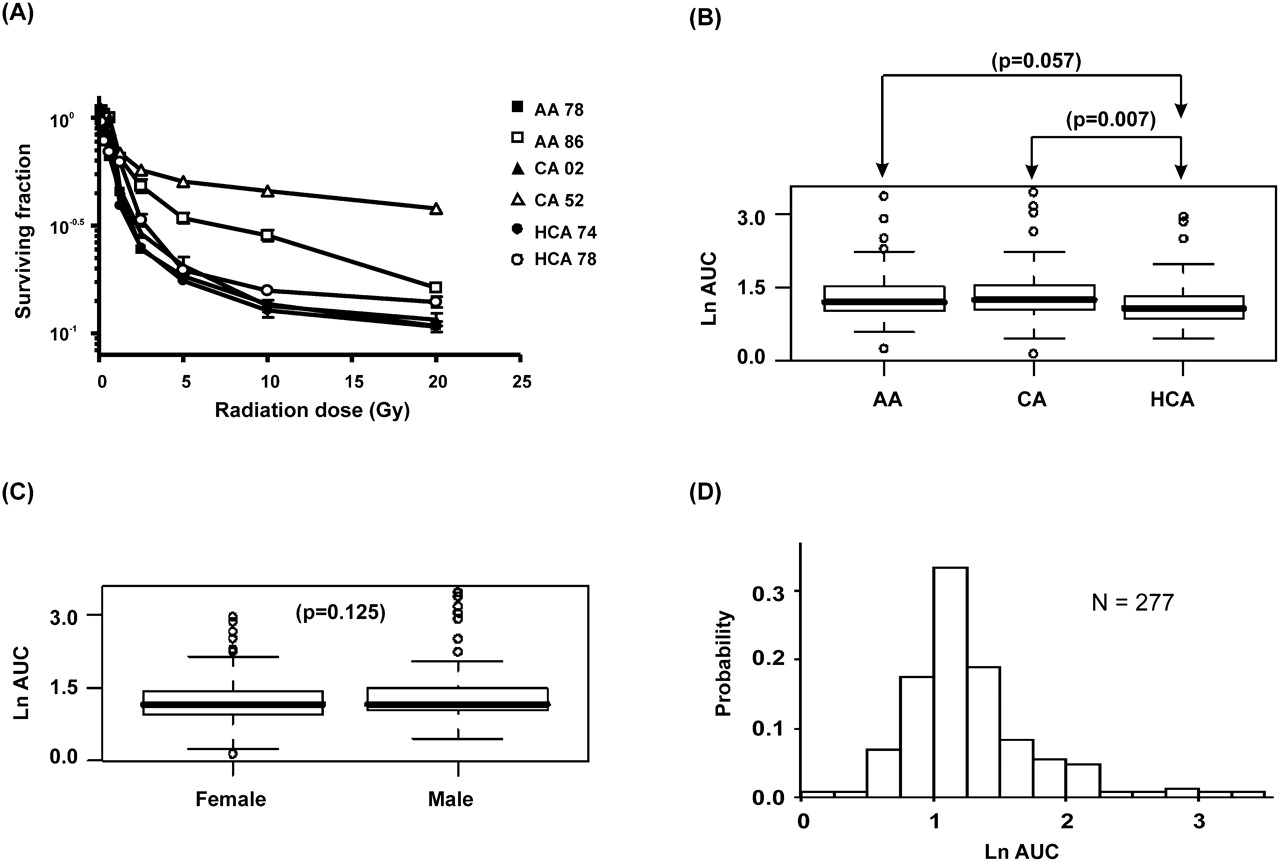
Figure 1.
Radiation cytotoxicity. (A) Representative radiation cytotoxicity dose-response curves. Two cell lines from each of the three ethnic groups studied were selected to illustrate a range of radiation cytotoxicity “dose response” curves. Squares indicate African-Americans (AA), triangles Caucasian-Americans (CA), and circles indicate Han Chinese–Americans (HCA). The x-axis indicates radiation dose, and the y-axis indicates the surviving fraction after radiation exposure. (B) Relationship of ethnic group to radiation AUC. (C) Gender effect on radiation AUC. (D) Frequency distribution histogram of natural-log (ln) AUC values for 277 cell lines.


