
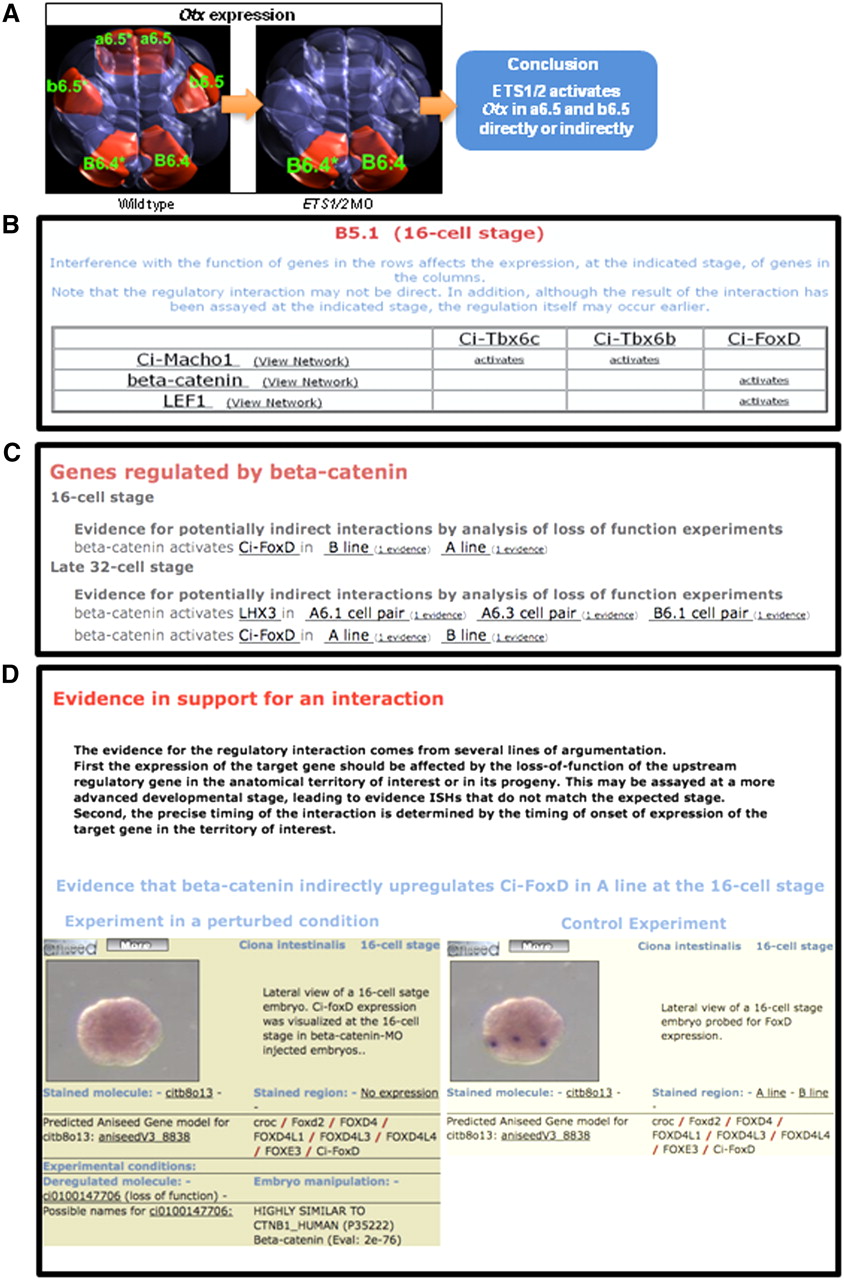
Automatic inference of transcriptional regulatory interactions. (A) Example of the inference logic that led to the establishment of a regulatory interaction between ETS1/2 and Otx in a6.5 and b6.5 neural precursors at the late 32-cell stage. Use of an antisense Morpholino oligonucleotide is interpreted as a loss-of-function experiment. Territories in which Otx expression is lost are thus territories where ETS1/2 regulates Otx expression. (B) Screenshot of the “Anatomy Regulation” card for the B5.1 precursor at the 16-cell stage, showing the regulatory interactions that take place in the lineage leading to this blastomere. (C) Screenshot of the “Downstream Target” card of beta-catenin, showing transcriptional targets of this gene at the 16-cell and late 32-cell stages. Note that the anatomical territories in which the regulatory interactions are confirmed as indicated. (D) Screenshot of the page presenting the evidence that beta-catenin upregulates Ci-FoxD in the A-line at the 16-cell stage. Supplemental Figure S9 presents the number of inferred regulatory links at each developmental stage.


