
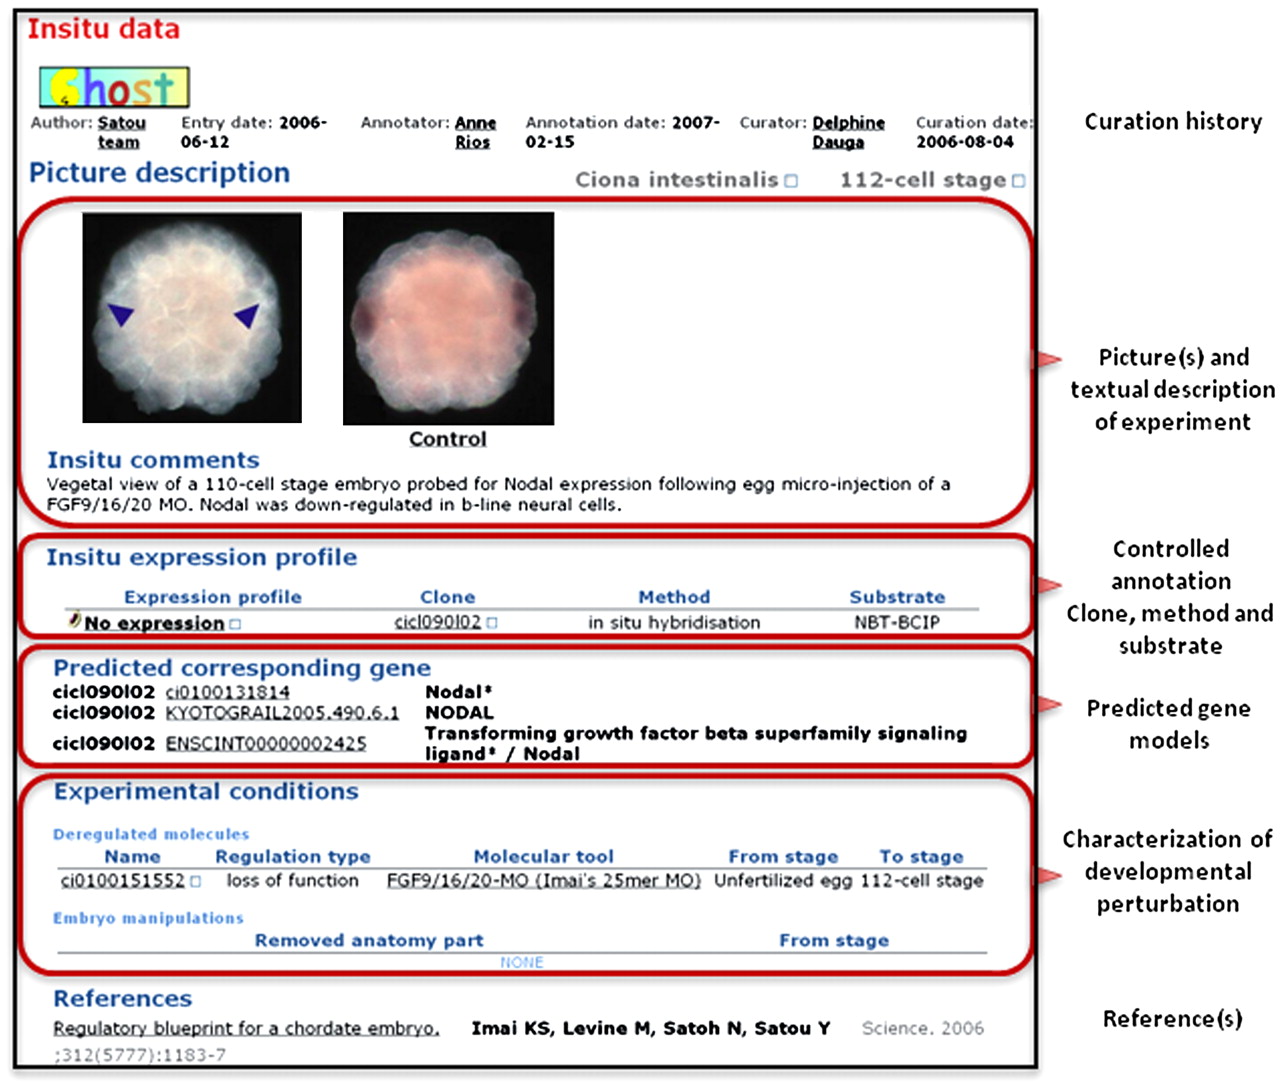
Figure 4.
Representation of spatial expression patterns. Screenshot of the expression card describing the expression of the Ciona intestinalis Nodal gene at the early gastrula stage, in response to the inhibition of FGF9/16/20 function. Note the control picture that was taken in the same experiment; clicking on the “control” word leads to the description of the expression in wild-type conditions.


