
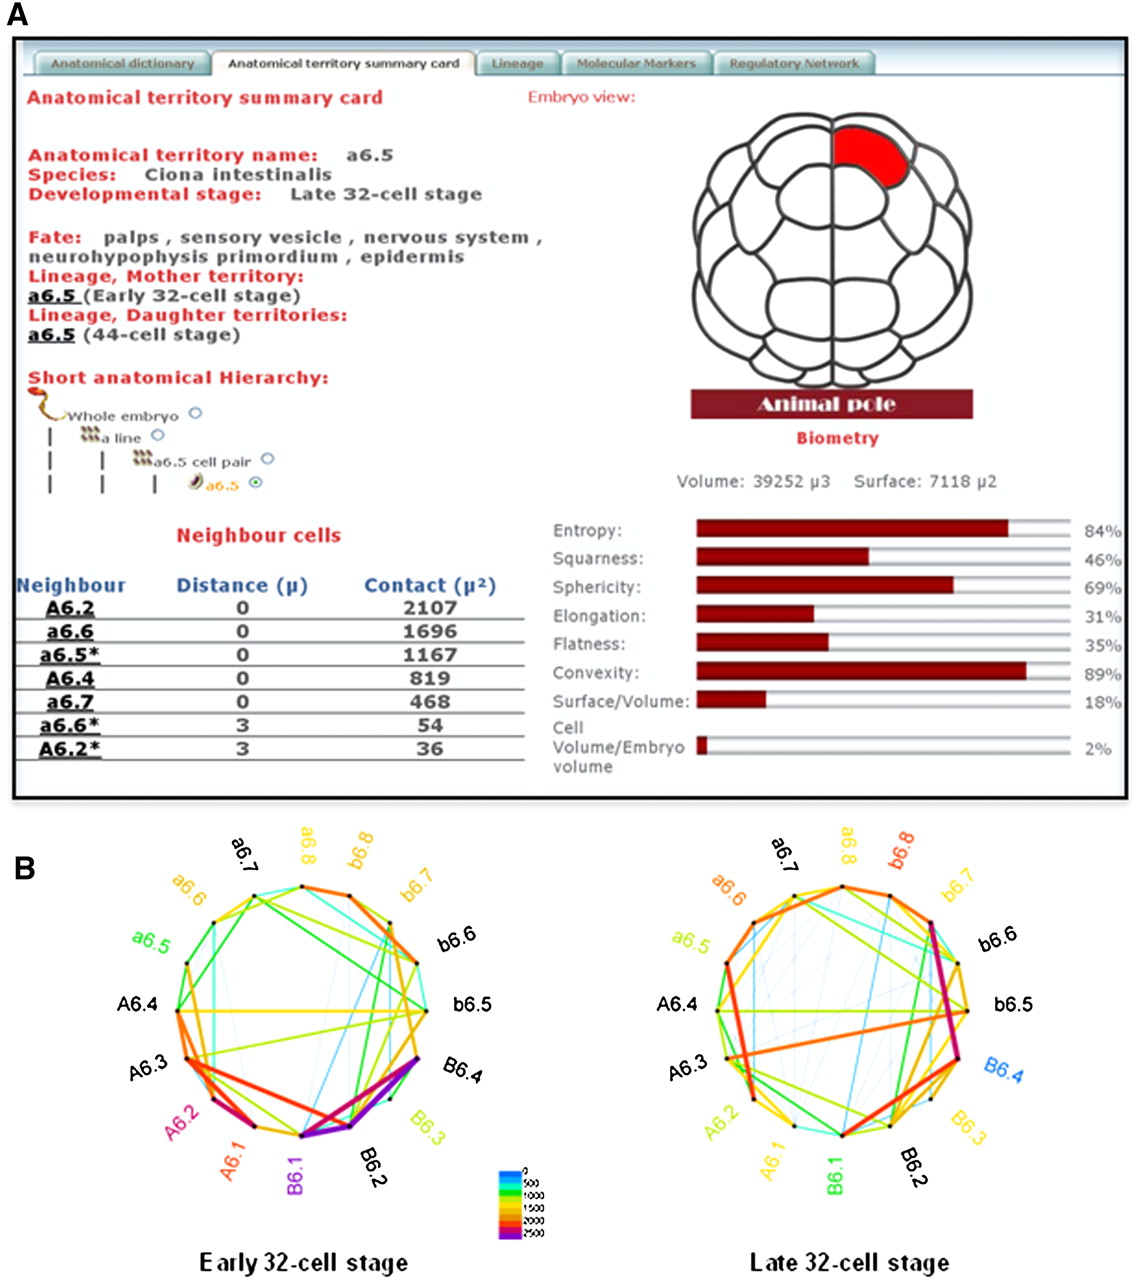
Representation of embryonic anatomy. (A) Screenshot of an anatomical territory card representing the lineage, fate, position/contacts with neighbors, and geometry of the a6.5 cell at the early 32-cell stage. Note the tabs at the top of the screen capture that lead to the whole anatomical ontology for the stage of interest (“Anatomical Ontology”), to the precursors and progeny of the territory of interest (“Lineage”), to expression profiles restricted to this territory (“Molecular Markers”), and to the regulatory interactions that take place in the lineage leading to this territory (“Regulatory Network”). (B) Neighborhood graph showing which cells of the late 32-cell embryo contact each other. The nodes of the graph represent individual cells, the edges represent contacts. The thickness of the edge reflects the area of contact between adjacent cells. The indicated values are in square microns. Supplemental Figures S3 and S4 give more details about the description of ascidian anatomy in ANISEED.


