
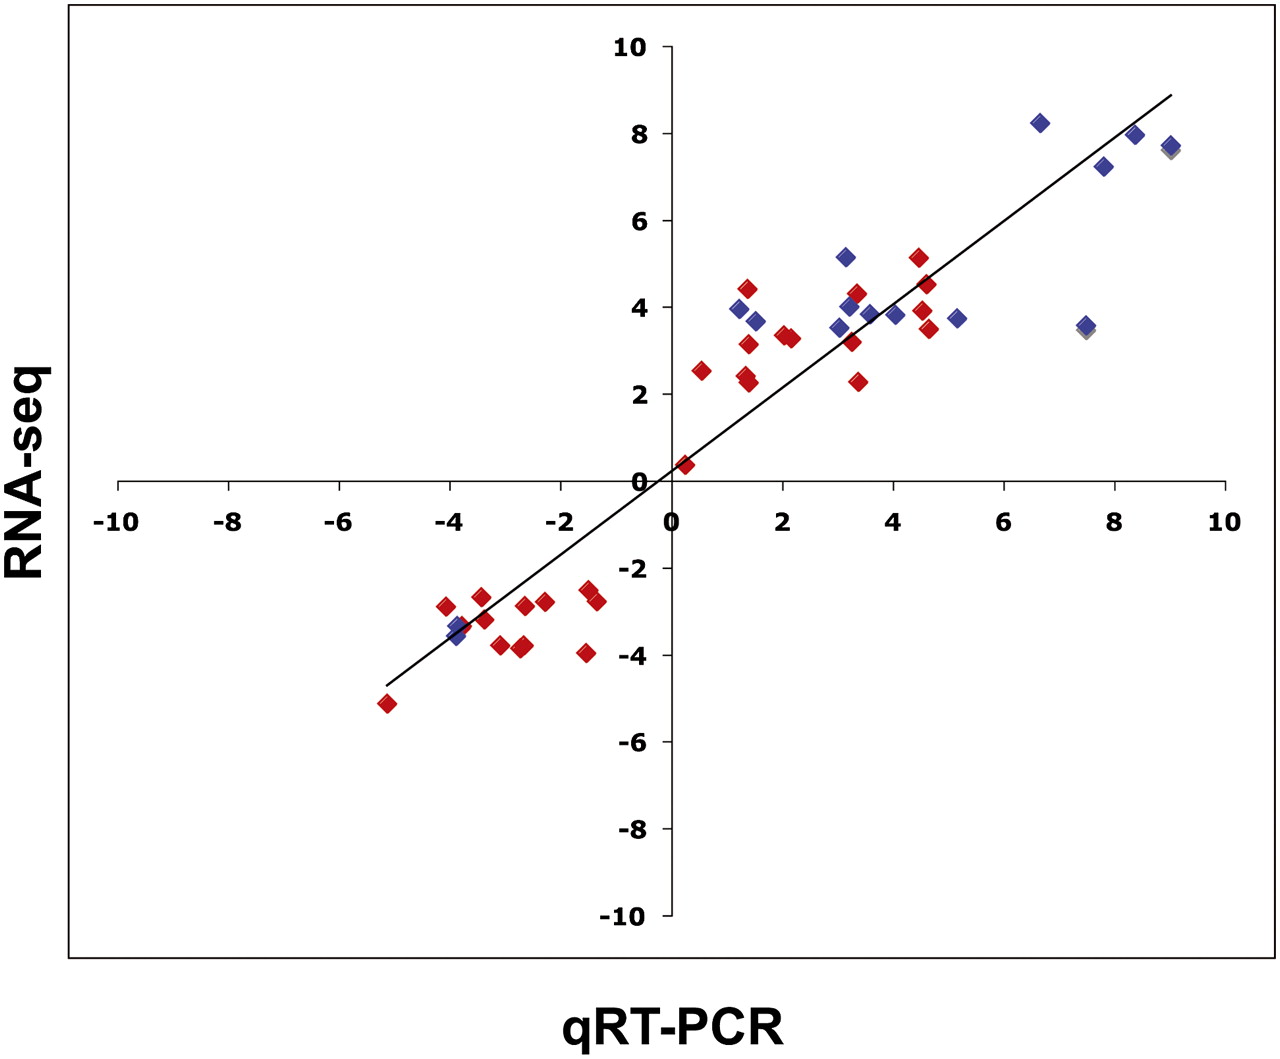
Figure 6.
Verification of gene expression analysis by quantitative real-time PCR (qRT-PCR). Individual gene expression ratios (treated/untreated) were calculated using RPKM data generated by RNA-seq and plotted against calculations done for the same gene using qRT-PCR. Red diamonds represent novel transcripts. Blue diamonds represent annotated genes that were previously not known to be regulated under that particular condition. The Pearson correlation is 0.929.


