
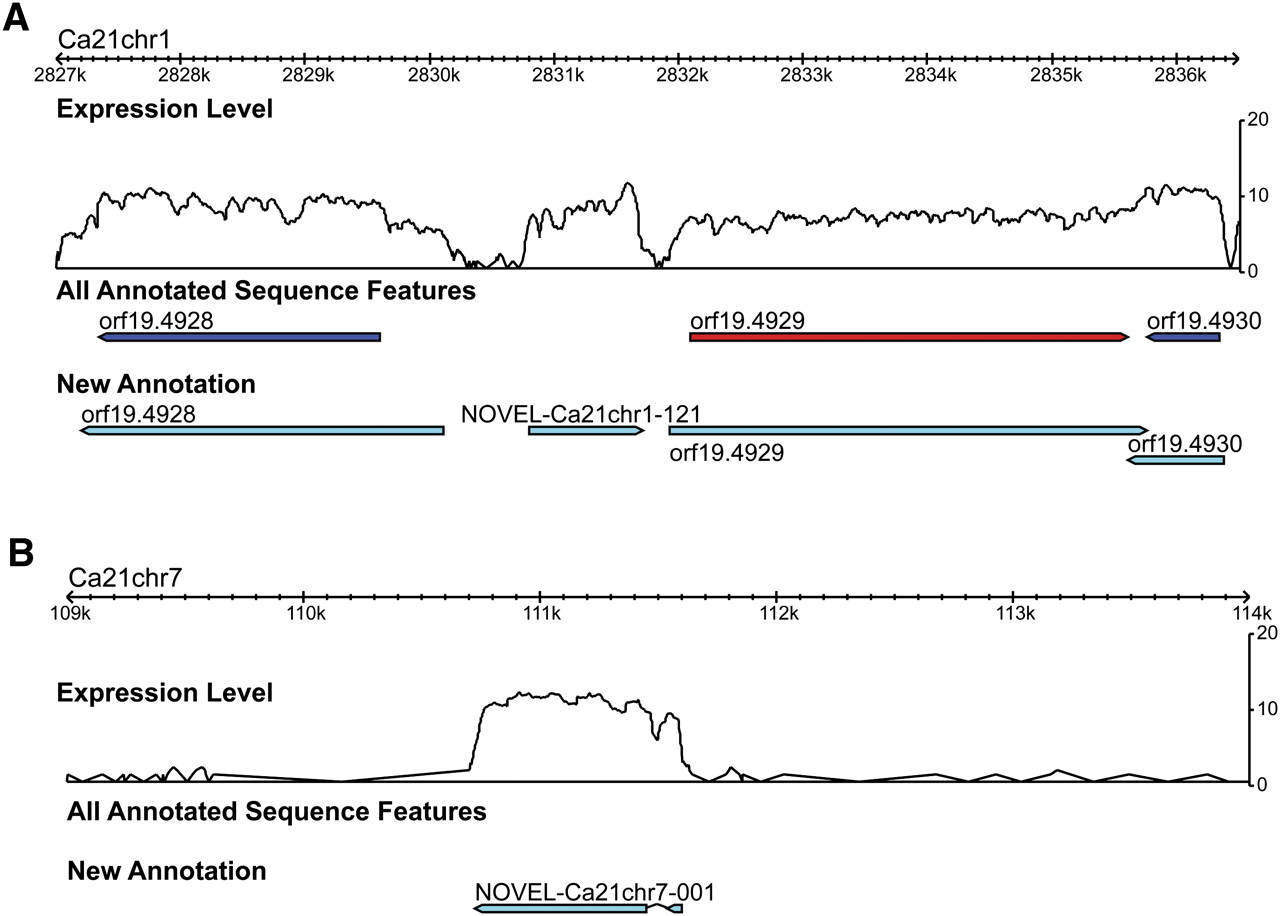
Figure 4.
Identification of novel transcriptionally active regions (TARs). Signal tracks for examples of novel transcripts that are present in a region of chromosome 1 that has several annotated features (A) and a region on chromosome 7 that does not have any annotated features (B). Red and dark blue bars represent annotated ORFs according to the Candida Genome Database (CGD). Light blue bars represent RNA-seq–driven annotations, which include ORF plus 5′ and 3′ untranslated regions (UTRs). Introns are depicted as two colored bars (exons) connected by a bent gray line.


