
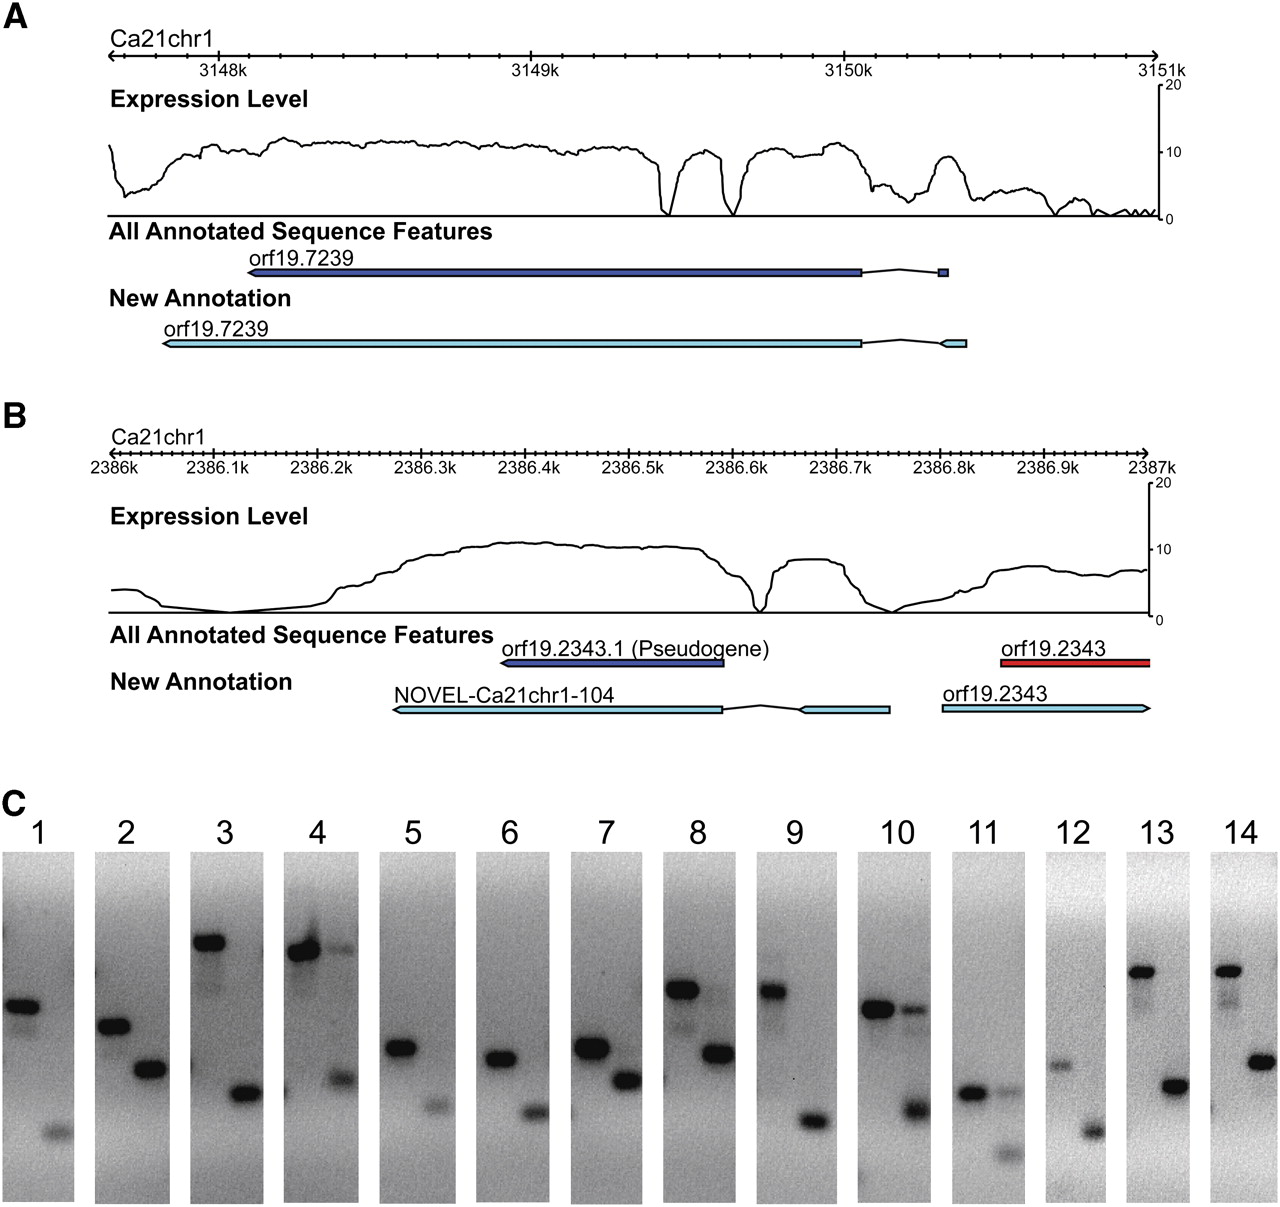
Intron identification and validation. (A, B) Signal tracks representing an example of a known, previously annotated, intron (A) and a novel intron (B) identified using our RNA-seq data. Red and dark blue bars represent annotated ORFs according to the Candida Genome Database (CGD). Light blue bars represent RNA-seq–driven annotations, which include ORF plus 5′ and 3′ untranslated regions (UTRs). Introns are depicted as two colored bars (exons) connected by a bent gray line. (C) Validation of introns by RT-PCR. Each panel represents a different novel intron being assayed by a different pair of oligonucleotides flanking the intron. The left lane in each panel is a PCR product derived from genomic DNA. The right lane in each panel is a PCR product derived from cDNA.


