
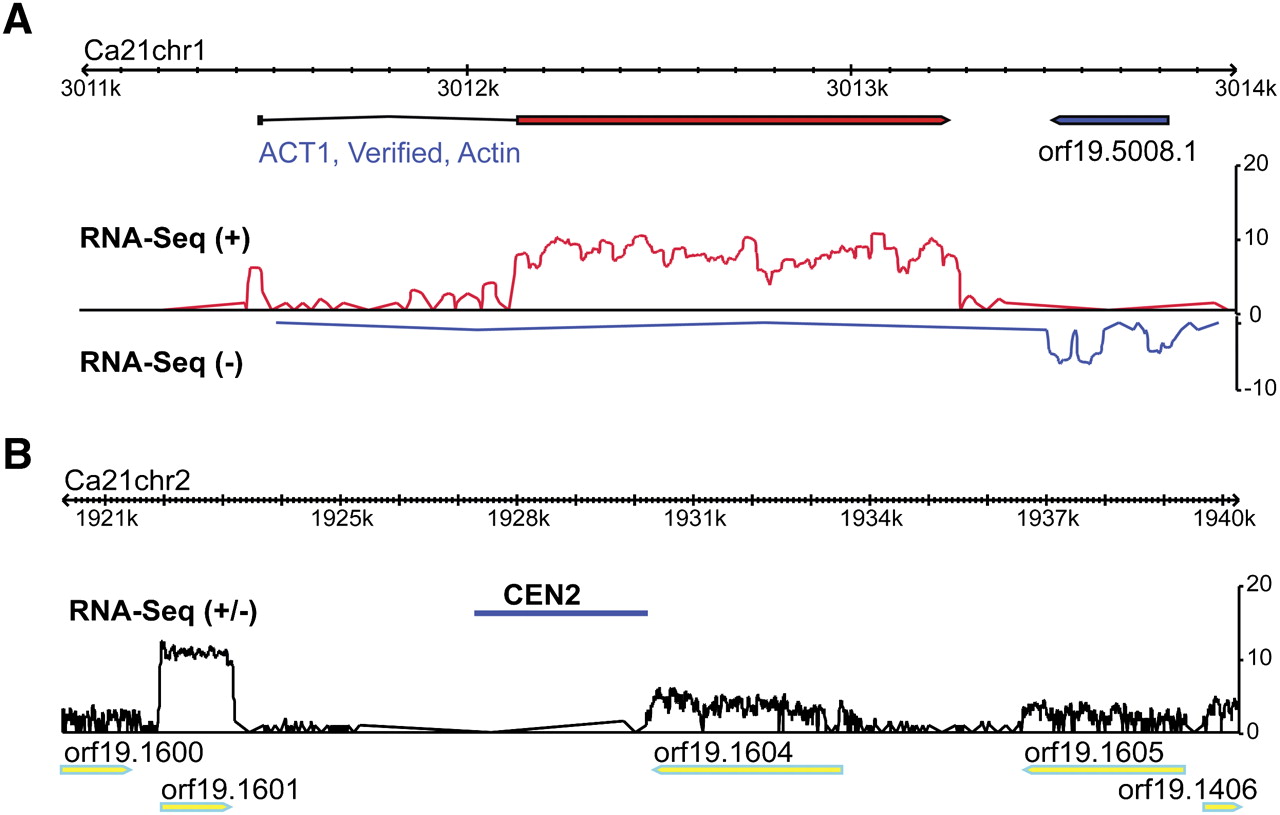
Figure 1.
Representative signal tracks of RNA-seq data. Data are from C. albicans strain SC5314 grown in YPD. (A) Strand-specific representation of expression in the genomic region surrounding the ACT1 locus. Red or blue boxes above the signal tracks represent Candida Genome Database (CGD) annotated features. The red line represents transcription from the positive strand. The blue line represents transcription from the negative strand. (B) Strand nonspecific representation of transcription in the genomic region immediately surrounding the centromere on chromosome 2 (CEN2).


