
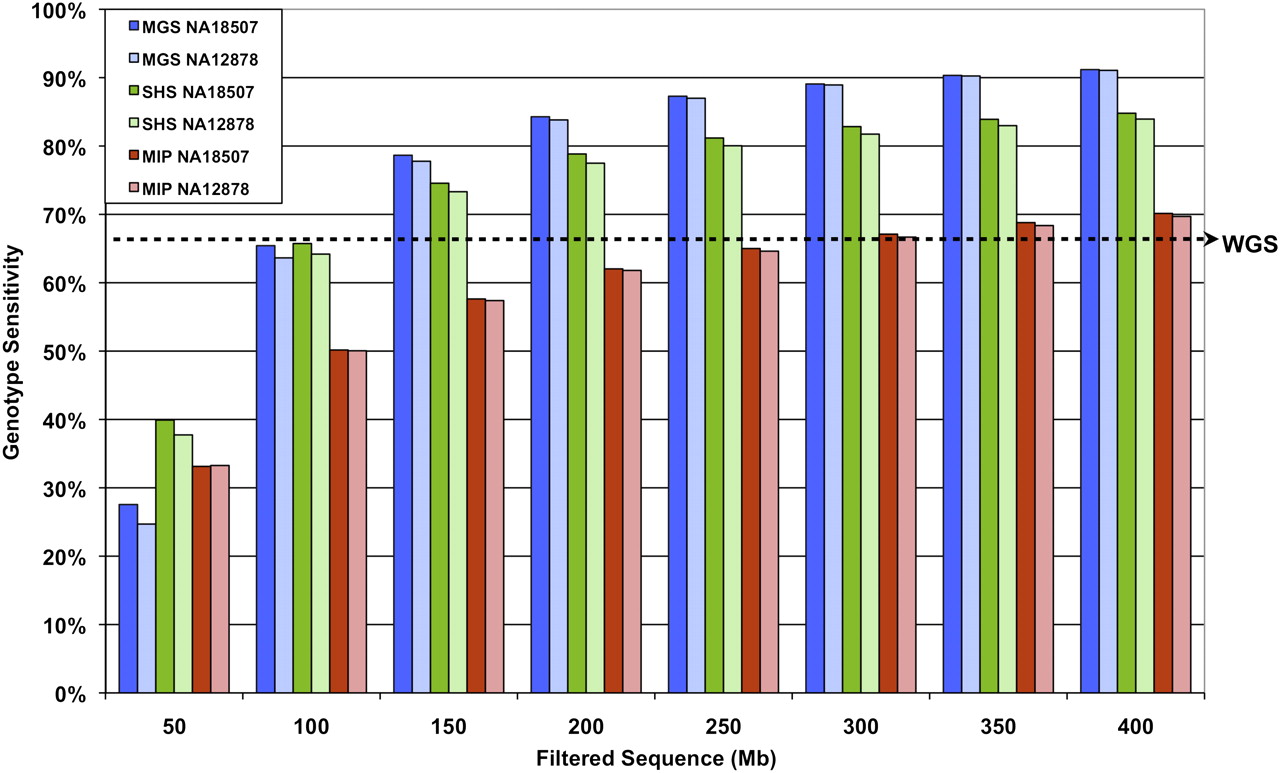
Figure 5.
Genotype sensitivity with increasing sequence data. Percentage of genotypes assigned in the ROI (same for all methods) with increasing filtered sequence data for NA18507 and NA12878. Sequence counts are based on 36 bases per read for MIP and SHS. To account for the 6-base index bar code, 42 bases were used in the sequence count calculations for MGS. The dashed arrow indicates genotype sensitivity level (67.3%) of 30-fold coverage whole-genome shotgun (WG) data for the ROI analyzed in this study.


