
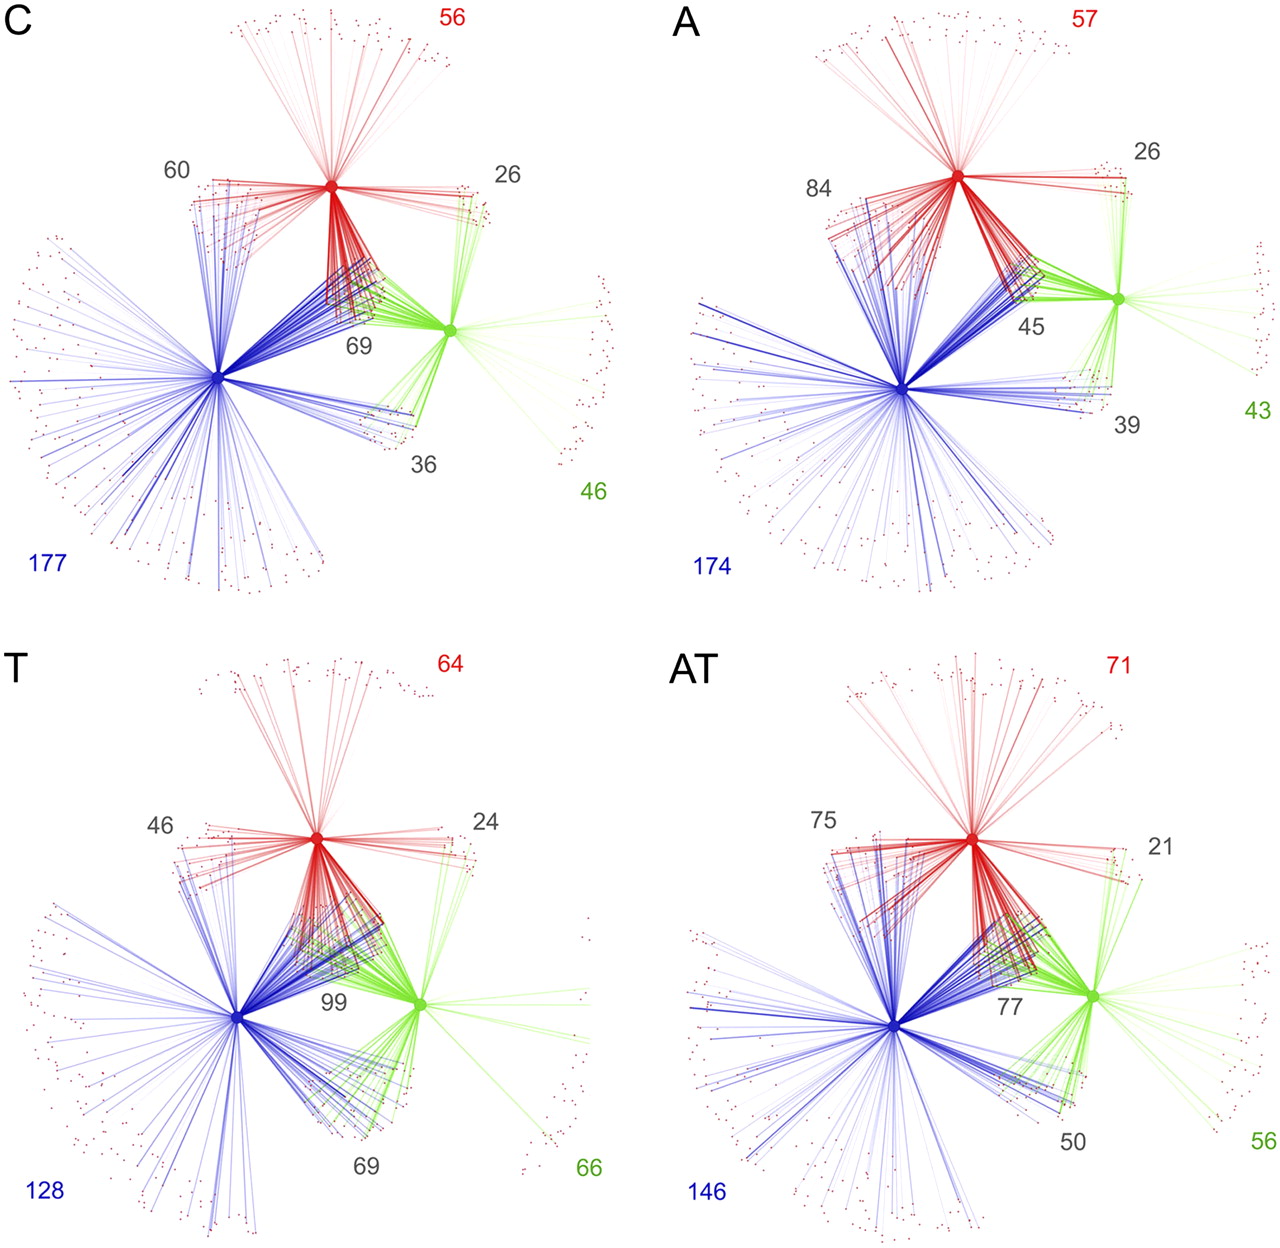
Network plots of shared microbial diversity. The relationships between phylotypes and samples are represented as a bipartite graph in which nodes are either phylotypes (small) or samples (large), and connecting lines between small and large nodes mean that the phylotype was found in the given sample. Colors of lines and large nodes indicate the donor sample (blue), the sample before treatment (red), and the sample obtained 3 mo after treatment (green). The intensity (opacity) of each line reflects the relative abundance of each detected phylotype in a given sample; the groups of phylotypes that join any given pair of samples indicate the proportion of shared phylotypes, and the phylotypes connected to only a single sample are unique. The number of shared phylotypes between samples and phylotypes uniquely found in each sample is indicated. The panels represent the controls (C), effects of antibiotics only (A), transplantation only (T), or transplantation with antibiotics (AT). Intersections of red, blue, and green lines show common phylotypes between donor and recipient rats at any time-point.


